Global Temperatures are Spiking
What are the implications for long-term global warming and extreme weather in the United States?
-
-
Share
-
Share via Twitter -
Share via Facebook -
Share via Email
-
Editor’s note: This is the third installment in “The Climate Report” collaborative series from The Liberal Patriot and The Breakthrough Institute looking at the science and reporting behind extreme weather events and other climate related matters.
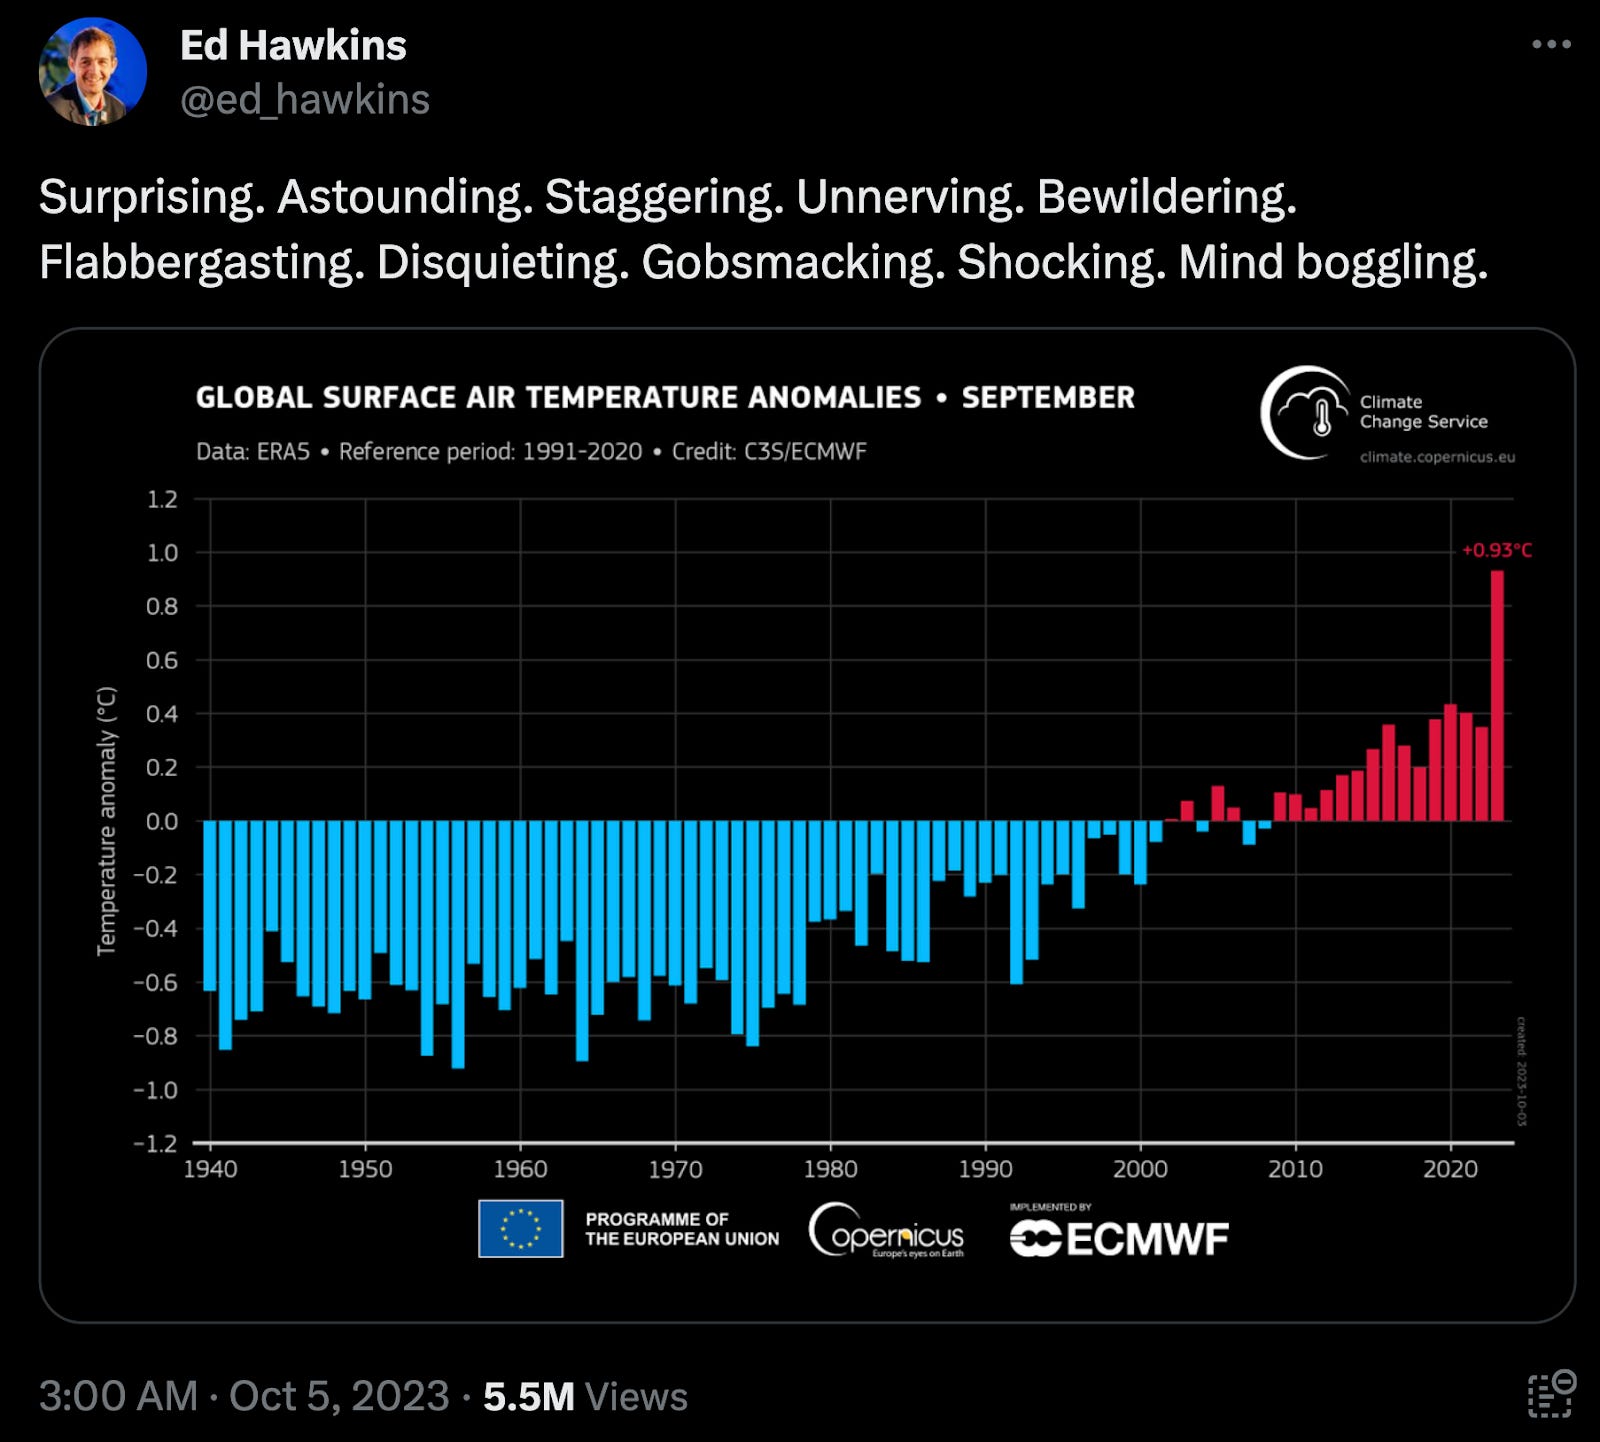
The Northern Hemisphere summer of 2023 began a string of days and now months where average global surface air temperatures broke their previous records by substantial margins. July 2023 was the overall warmest month on record, and September 2023 was the most anomalously warm month on record—that is, warmest relative to the average for that month, where records stretch back to the late 1800s. In concrete numbers, September was about 0.5°C or 0.9°F warmer than the previous September record of 2020.
This development has generated significant attention with headlines like, “Off-the-charts records’: has humanity finally broken the climate?” from The Guardian, “Scientist calls record global heat in September ‘gobsmackingly bananas,” from CNN, and “Global record breaking temperature is ‘500x bigger’ than expectations,” from the UK’s Channel 4 News. It has also been the topic of discussion on Climate Twitter.
The spike in global temperatures has also been tied to a summer of supposedly unusually disastrous weather in the United States by the New York Times.
So what is causing global temperatures to spike, and what are the implications for our understanding of long-term global warming and extreme weather in the United States?
Global Temperature Variability
Global temperature change is the result of many factors that act on different timescales (I did my Ph.D. dissertation on a portion of this topic). It can be helpful to break these causes down into those that are human-caused versus those that are natural, as well as those that are “forced” versus those that are “unforced.”

Forced changes are imposed on the ocean-atmosphere system from some cause outside of the system, like a change in the amount of energy coming from the Sun or extra energy trapped by human emissions of greenhouse gasses like CO2.
However, global temperature can also spontaneously change without being forced to do so. Fittingly, these are referred to as “unforced” temperature changes. Unforced temperature changes come from natural ocean-atmosphere interactions that can rearrange the clouds, sea ice, and the distribution of heat, which results in global average surface air temperature change.
All these causes introduce temperature variability on different timescales, but the only cause currently pushing temperatures up on century timescales is the persistent increase in greenhouse gas concentrations from human activities like burning fossil fuels. Importantly, though, this upward push is relatively gradual and persistent from year to year, and it cannot explain monthly or yearly lurches in temperature like the one we are currently seeing.
In order to explain the current spike, we need to look at factors other than the relatively slow increase in greenhouse gas concentrations. It turns out that virtually all the other important short-term drivers of global temperature variability may be conspiring to cause an upward spike at the same time:
- El Niño: The El Niño/La Niña cycle in the Pacific Ocean is the form of unforced variability that has the most influence on global temperatures on timescales of months to years. During La Niña years, an unusual amount of heat is sequestered in the Pacific Ocean below the surface, while during El Niño years, that heat is released back to the surface, where it temporarily elevates global temperatures before being radiated to space. We are currently seeing El Niño conditions, with forecasts indicating that these conditions will strengthen through this winter, continuing to elevate global temperatures through 2024.
- Volcanic Activity: The 2022 eruption of the Hunga Tonga–Hunga Haʻapai volcano injected large amounts of water vapor (a greenhouse gas) into the upper atmosphere, where it can persist for several years and cause short-term warming.
- Solar Activity: The amount of energy coming from the Sun follows an 11-year cycle. The last trough of activity bottomed out in 2020, and we are on our way to the next peak in 2024-2025–giving global temperatures a small boost.
- Reduced Pollution from Shipping Sector: The 2020 implementation of international regulations on sulfur air pollution from shipping has allowed more solar radiation to reach the surface and had a slight global warming effect.
- Atlantic Multidecadal Variability: Sea surface temperatures in the Atlantic contain an element of unforced variability, and these are currently in their positive phase, pushing global temperatures up.
- Other factors: There is a lot more to unforced variability than just the named oscillations, and it appears that other components, like those related to Antarctic sea ice, may be acting to push global temperatures up as well.
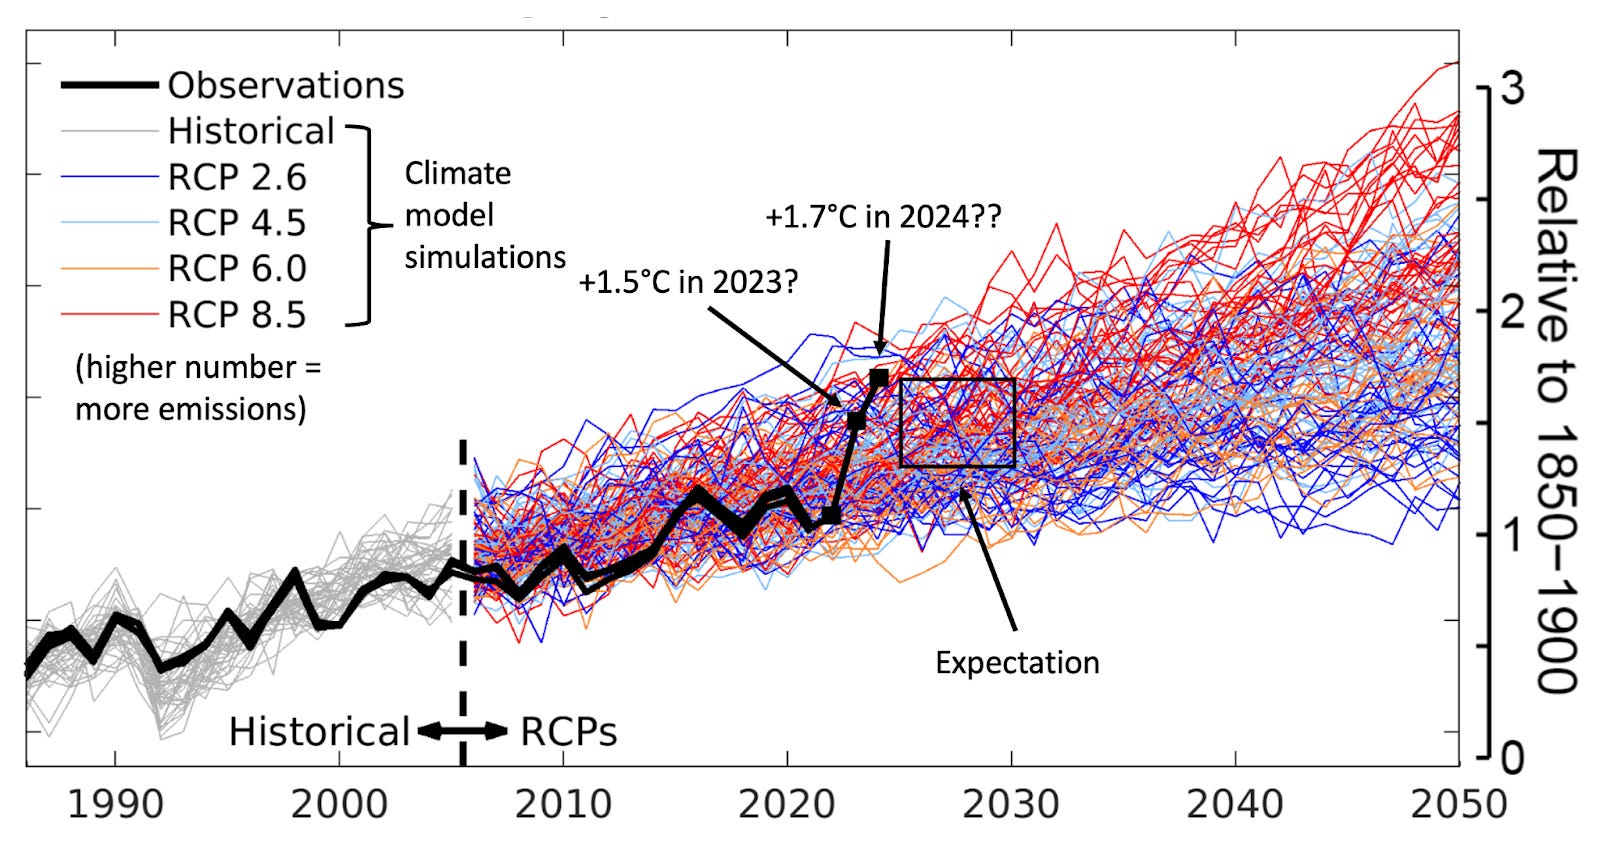
So, all of these factors are currently pushing global temperatures in the upward direction, and as a result, 2023 will set a new annual record for global warmth. It is difficult to assess precisely what the final number will be, but in at least some datasets, 2023 might be the first year to breach the +1.5°C (+2.7°F) level of warming above preindustrial levels (note that this is not a particularly meaningful geophysical threshold). Typically, an El Niño like the current one would cause further warming in the year after it developed. So let’s further hypothesize that 2024 is another 0.2°C warmer than 2023, and thus +1.7°C. Would these observations drastically change our understanding of our long-term warming trajectory?
The figure below places these hypothetical warming levels in the context of projections from climate models driven by long-term increases in greenhouse gas concentrations (colors represent different amounts of emissions), but that simulate their own unforced variability. We can see that a hypothetical spike up to +1.7°C in 2024 would move temperatures from near the bottom of the envelope in 2021 to near the top in 2024. Given the unusual coincidence of so many factors pushing in the warming direction at the same time, this fluctuation might not be entirely surprising. However, we expect most of the factors other than increasing greenhouse gas concentrations to reverse in the coming years, so the mainstream expectation would be that temperatures would fall back down into the middle of the projections in the 2nd half of this decade. There is also the possibility that climate models underestimate the magnitude of unforced variability, and the envelopes below are, therefore too narrow.
Below is the same data superimposed on long-term projections from climate models. It shows that the calculated forced temperature change from human emissions in 2024 would be around +1.35°C. So if 2024 did come in at +1.7°C, we could say that about 80% of that warmth (relative to preindustrial) was due to human activity, and 20% was due to all the other factors. It also shows that short-term spikes probably tell us very little about our long-term trajectory, and a trend would need to be sustained for decades in order for it to have meaningful implications on expectations for long-term warming.

Even if temperatures return to the middle of the climate model projection envelope by the late 2020s; however, we still expect temperatures like those seen in 2023 to be commonplace in the 2030s. Any drastic change in weather at the regional level (like in the U.S.) associated with this level of global warmth would be quite concerning when considering climate impacts over the coming decades.
Implications for Devastating Weather in the United States
On that front, the New York Times purported to connect the recent spike in global temperatures to a summer of unusually devastating weather in the US in a piece called, “Why Summers May Never Be the Same. The globe’s warmest months on record redefined summer for many Americans.”
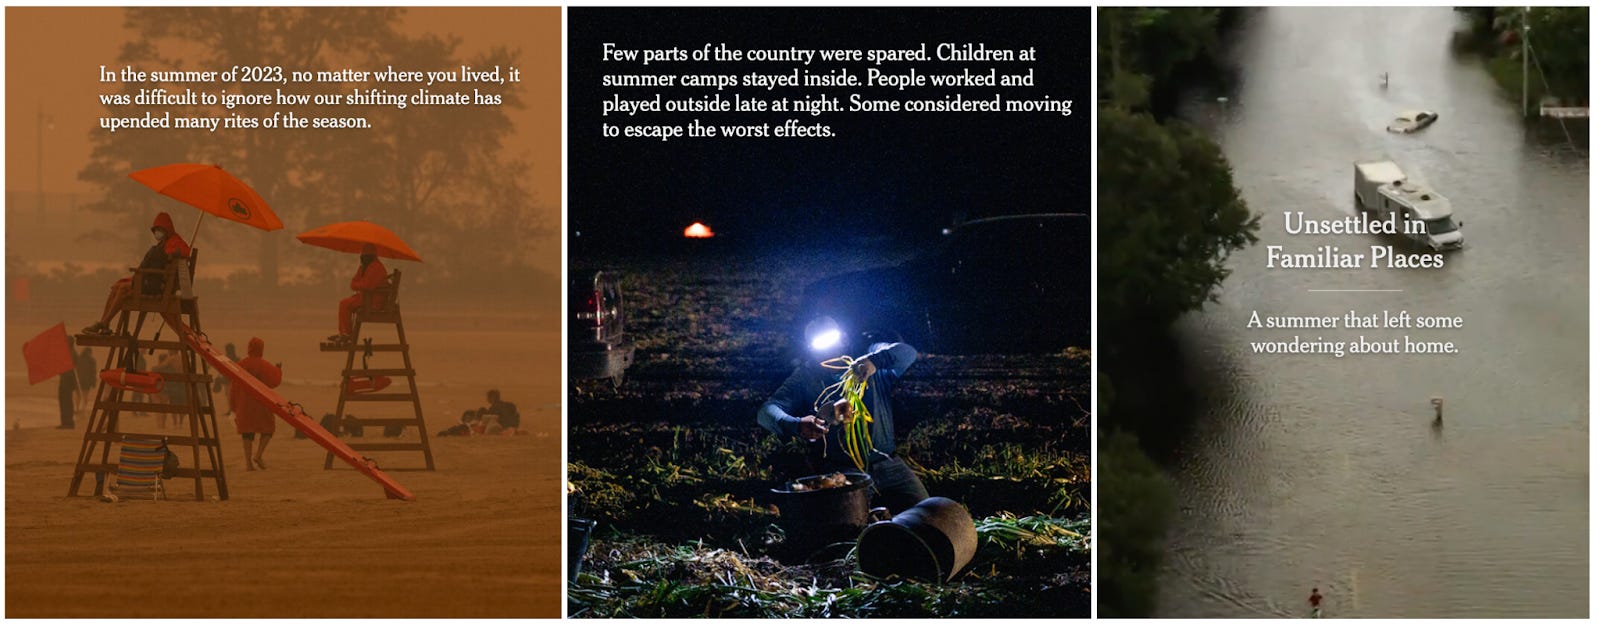
The piece uses a string of anecdotes on extreme heat, drought, floods, and wildfire smoke to paint an apocalyptic picture of what the summer of 2023 was like in the United States. In order to assess how unusual the summer of 2023 was–and get a better understanding of the magnitude of change that we are seeing–we can place these anecdotes in context by looking at empirical data compiled by the National Oceanic and Atmospheric Administration (NOAA).
Heat
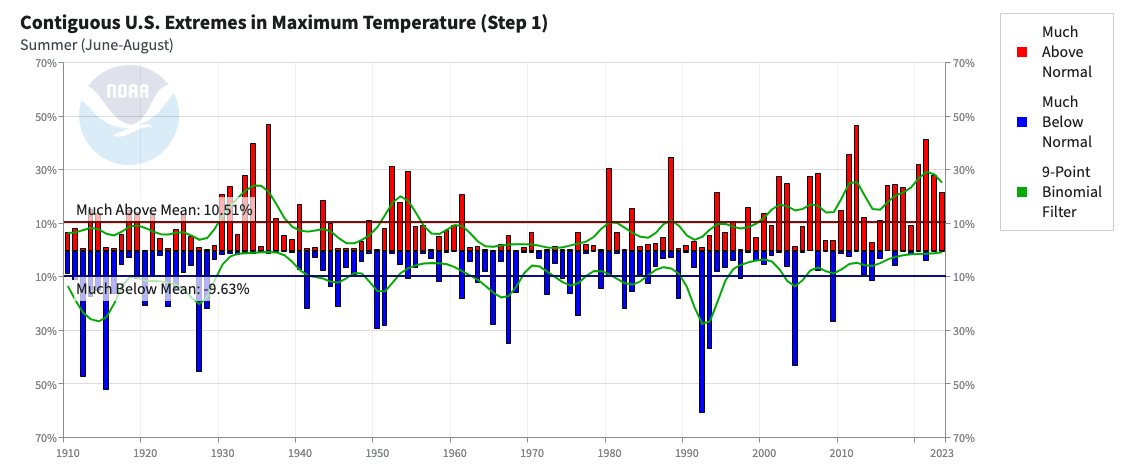
The article tells a number of stories about extreme heat, certainly giving the impression that 2023 was particularly exceptional in the United States. However, when we look at the data, the picture painted is not quite as dramatic. It turns out that while global average temperatures have been setting records, 2023 was only the 15th warmest US summer on record, going back to 1895, notably behind 1934 and 1936. How much warmer? The 2023 U.S. summer had an average temperature of 73°F which was 1.6°F warmer than the 20th century average of 71.4°F. This is not too different from the equivalent calculation for the global average temperature, which was 2.2°F above its 20th-century average.

But what about extreme heat? The 2023 U.S. summer ranked 17th out of 114 years in terms of how many days saw local extreme heat (above the local 90th percentile for that time of the year). Interestingly, 2023 came in behind several years from many decades ago like 1931, 1933, 1934, 1936, 1952, and 1954.
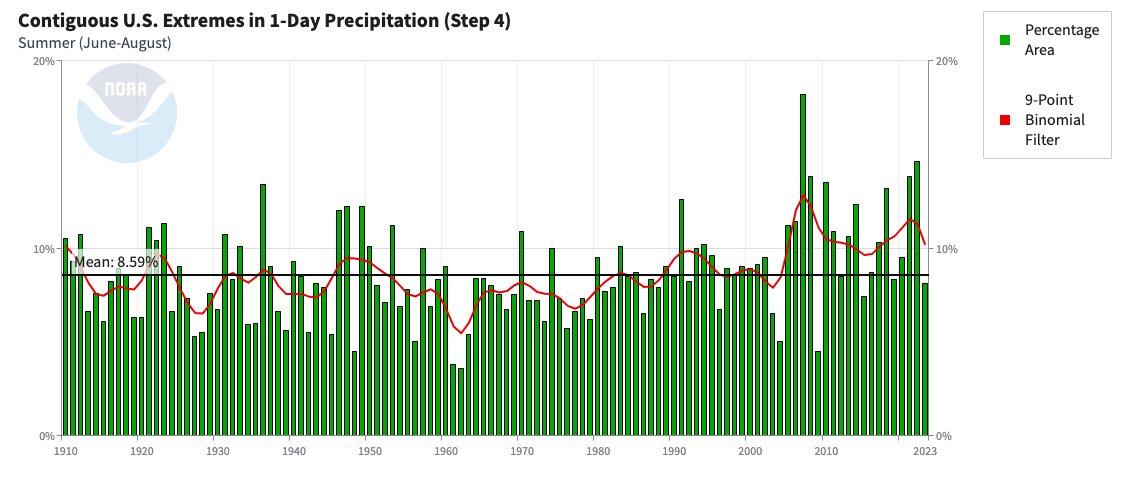
Extreme Rainfall
The New York Times piece tells several stories about floods brought on by extreme rainfall. While there is a long-term upward trend, it is interesting that the summer of 2023 was actually below the long-term average in terms of the fraction of the country that experienced extreme daily precipitation.
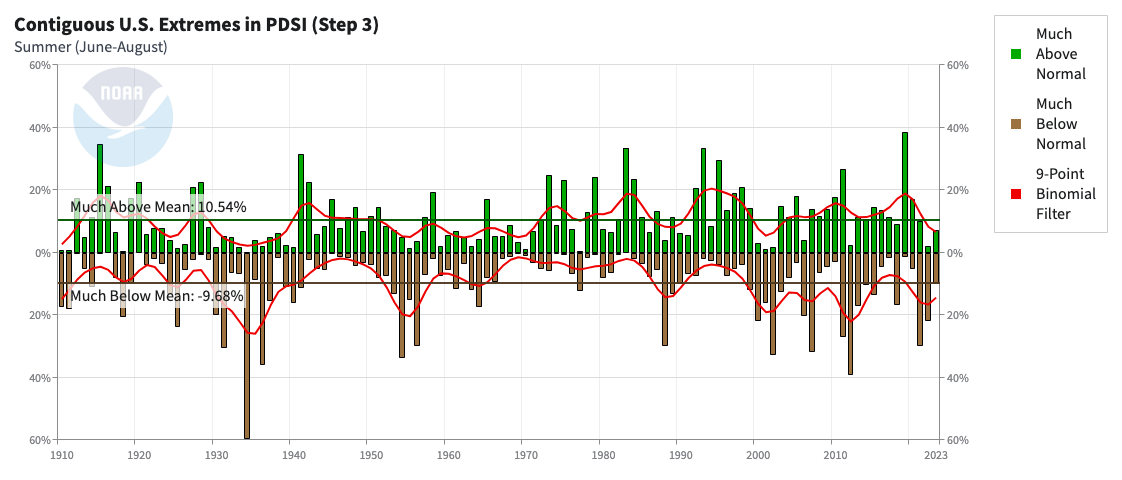
Droughts
The piece vaguely mentions droughts and parched cities, but the data on droughts indicates that 2023 was entirely unexceptional, and there are no obvious long-term trends in the occurrence of drought conditions throughout the U.S.
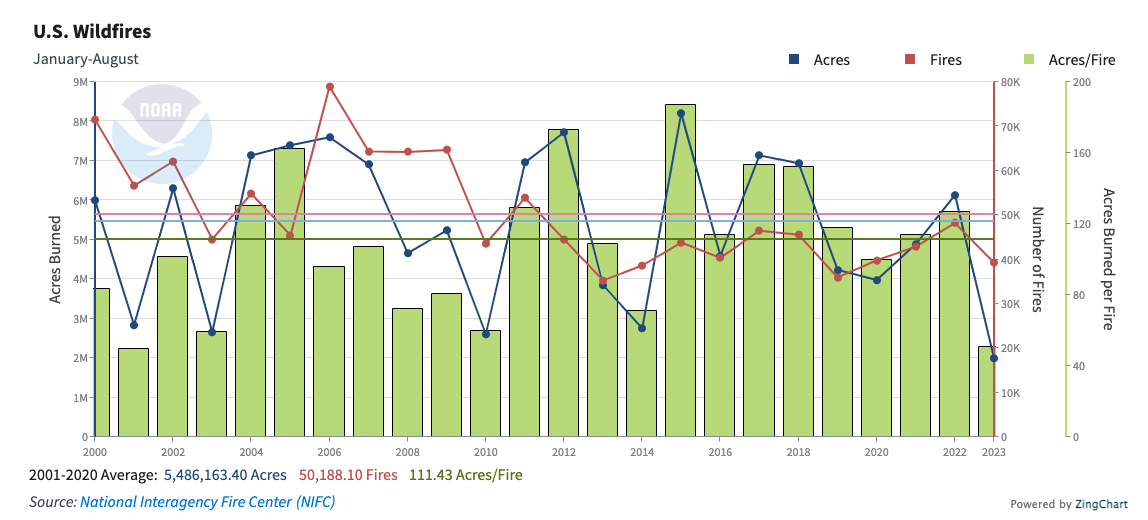
Wildfires
The piece also discusses the detrimental impacts of wildfire smoke. First, it is worth mentioning that this year has seen the lowest area burned in the U.S. in NOAA’s record back to 2000.
The disruptive wildfire smoke in the U.S. this summer came mostly from Canada, which has indeed experienced a record-shattering wildfire season. However, it is important to note that there was no clear long-term trend in Canadian wildfire activity prior to this year (giving us pause when thinking about the magnitude of the contribution of climate change to this year’s activity). When thinking about overall air quality, moreover, it’s relevant that a recent study found that increased wildfire smoke in the U.S. has caused plateaued or slightly reversed trends of improving air quality, but that wildfire smoke has hardly taken us back to the overall far worse air quality that the U.S. experienced decades ago.
Given that we expect the global temperatures of 2023 to be common by the 2030s, it would be quite alarming—as is implied by the New York Times piece—if that level of global warmth was associated with a radical uptick in devastating weather in the United States. Luckily, when we look at the empirical data, that does not appear to be the case. Reducing greenhouse gas emissions to net zero is critical for stabilizing global temperature and avoiding major impacts in the long run, but the data shows that stories about us currently living through unprecedented apocalyptic weather are overblown.
