Frequently Asked Questions About Population
Global Population in the 21st Century
-
-
Share
-
Share via Twitter -
Share via Facebook -
Share via Email
-
.Download this FAQ as a pdf here.
Q: Why is population relevant to the environment?
Human economic activities impact the environment through land use, freshwater consumption, pollution, and so on. A larger population can increase these pressures, but not always in a linear manner. Environmental impacts depend not only on the size of the population, but also how wealthy those people are, the nature of their consumption, and how those products are produced.1
For example, the average Northern European consumes more food and a larger variety of foods than the average West African.2 However, those two regions actually require a similar amount of cropland, per capita, for food production, because they use very different agricultural technologies.3 Ultimately, population size is an important, but not the only, factor determining human impacts on the environment.
Q: How fast is the population increasing today compared to in the past?
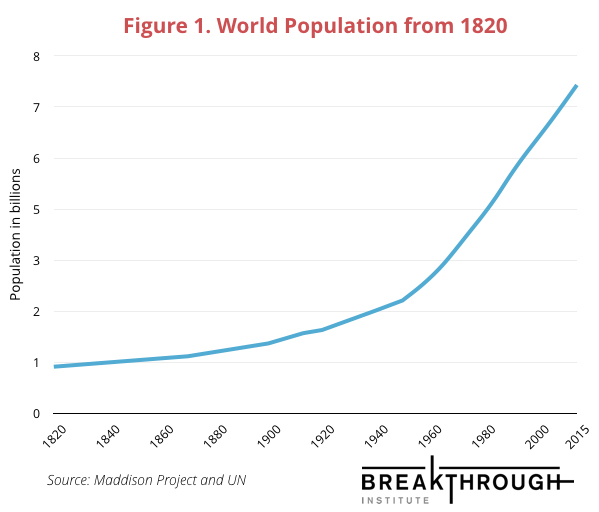
For all of human history until the 19th century, the world population was less than 1 billion people. Today, it is more than 7 billion (see Figure 1). The 20th century saw an unprecedented growth in the world population.
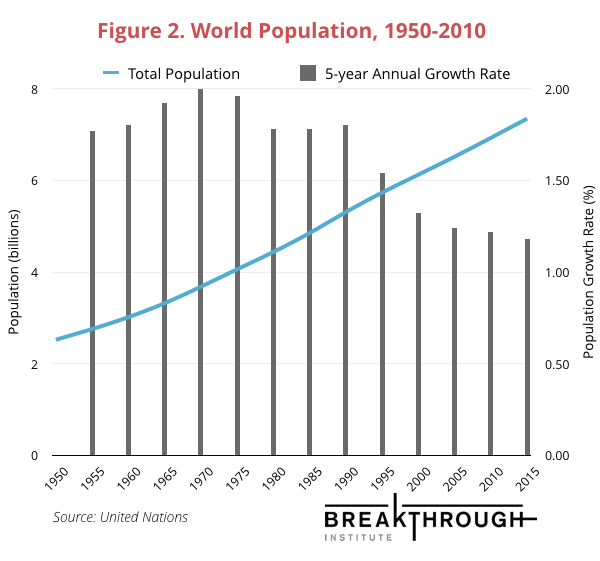
The rate of population growth peaked in 1970 at 2.06 percent per year, but has fallen from that peak to 1.18 percent today. Although the total population continues to grow, the rate of growth is slowing (see Figure 2).
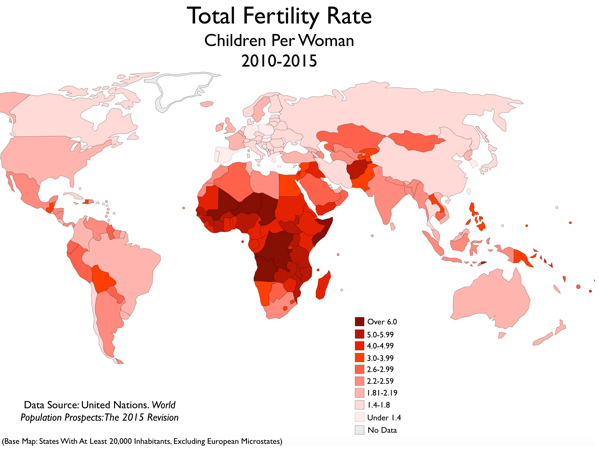
Falling fertility rates help explain the slowing of population growth. The following maps compare global fertility rates in 1950 and 2015, and show the current population growth rates by country.


Maps courtesy of Martin Lewis (read more)
The total fertility rate shown in the maps above describes the number of children born to each woman, on average. The replacement fertility rate describes how many children, on average, each woman would have in order to keep the population stable. The intuitive answer is that two children are needed to replace two parents. At the population level, however, mortality has to be factored in and unfortunately, not all children live to child-bearing age, especially in poor countries.
In developed countries, most children live to adulthood and the replacement rate is about 2.1 children per woman. In poor countries, however, higher mortality means that fertility rates as high as 3.5 children per woman are needed to keep the population stable.4 This means some fertility rates may seem higher than they actually are: a fertility rate of 6 in a very poor country may only be 2.5 children above the replacement rate.
Q: What factors influence population trends?
Population is ultimately determined by the rate of births and deaths. But birth and death rates are driven by other factors, like education, economic development, access to healthcare and family planning, and cultural norms.
The rapid population growth of the 20th centuries, for example, was largely due to improvements in health, nutrition, and sanitation that lowered mortality rates. Beginning with the Industrial Revolution in Europe, these improvements started to spread around the world and mortality rates, especially among infants, declined rapidly.5 With people living longer, the overall population grew. Today, people around the world are much more likely to die in old age than in infancy (see Figure 3).

Industrialization, economic growth, improved education systems, and greater contraception use helped bring about rapid fertility declines in southeast Asia in the last half-century. Today, rich countries have an average fertility rate below the replacement level of 2.1 children per woman. The countries that still have high fertility rates in the 21st-century tend to be in poorer countries, especially concentrated in Sub-Saharan Africa (see maps above).6 The widely-observed shift towards lower fertility and mortality rates as countries develop economically is called the demographic transition. Figure 4 shows that higher GDP per capita is associated with lower fertility rates.

There are several reasons why economic growth can lead to lower fertility. In developing countries where subsistence agriculture is the norm, children can be a source of labor and insurance, making larger families desireable.7 In places without access to modern healthcare, child mortality rates are also higher. This leads women to choose larger families in order to ensure that some of their children survive to adulthood.8 Education rates, especially among women, also tend to be lower in poor countries. With more education, women tend to marry later and are better able to access birth control, allowing them to invest more of their resources in fewer children.6
With something as personal as family size, cultural norms also play an important role. In Niger, for example, surveys found that even women with secondary schooling want 6 children on average, due to a cultural preference for large families.6 Conversely, some poor countries can see cultural shifts towards smaller family sizes even without major economic development.6 An interesting analysis in India, for example, found that TV ownership was associated with lower fertility rates. The author argues that parents were influenced by the modern, smaller families they saw portrayed as happy and successful on TV.
Public policy can also influence fertility rates, both directly and indirectly. Programs to promote family planning information and access to contraception can change fertility rates directly. A recent study of 40 high-fertility countries found that half of the difference in birth rates could be attributed to family planning efforts.9 However, since fertility is also related to other factors like healthcare and education, public policies to improve those outcomes can impact fertility rates as well.
Q: Isn’t the world overpopulated?
There have been social observers throughout history who warn that the world is headed for catastrophe due to overpopulation. In 1797, the Reverend Thomas Robert Malthus wrote his Essay on the Principle of Population to warn British elites that unchecked human procreation would lead to resource scarcity and eventual collapse. More recently, in 1968, the biologist Paul Ehrlich published his bestselling book, The Population Bomb, warning that overpopulation would lead to environmental catastrophe and mass starvation. Ehrlich’s book was published at a time when the global population was growing at its fastest rate, and many shared his fear.
Concerns about overpopulation ultimately stem from the question of how many people the Earth can support. However, the answer to that question is highly dependent on what kind of lifestyles those people lead, what technologies they use, and what social and economic institutions are in place.10 For example, the first Dutch settlers in what is now New York City would never have imagined that Manhattan Island would one day be home to 1.6 million people. That’s because the technologies that enable it, like skyscrapers and refrigeration, did not exist in the 17th century.
In his book How Many People Can the Earth Support?, Joel Cohen argues that his titular question “has no single numerical answer, now or ever.” He explains: “Because of the important roles of human choices, natural constraints and uncertainty, estimates of human carrying capacity cannot aspire to be more than conditional and probable estimates: if future choice are thus-and-so, then the human carrying capacity is likely to be so-and-so” (emphasis original).
Several studies have demonstrated the fungibility of this question. One study from a group of biologists, for example, estimated that using all the Earth’s land, we could support a population of 282 billion people.11 Even in their “save the forests” scenario, the population maximum was 150 billion. These are rather extreme thought experiments, and would create an Earth very different than today’s, but they help highlight that the Earth itself does not provide a single answer for how many people can live on it.
In general, it is safe to say that population growth increases resource pressures and leads to environmental harm, but there is no single “tipping point” or threshold that balances the human population and Earth’s resources.
Q: What would be the significance of a peak in population?
Although most human impacts on the environment continue to grow in absolute terms, many are declining at the per-capita level. For example, although total global freshwater consumption is increasing, it is increasing more slowly than the population, meaning each person is using less water today than thirty years ago. Efficiency gains have partly offset the growth in population.12 This decrease in per-capita consumption is called relative decoupling; if total water consumption begins to decline, that would be absolute decoupling.
A peak in human population offers the potential to achieve absolute decoupling, and with it major reductions in human impacts on the natural world. If the human population is no longer increasing, gains in per-capita efficiency will translate to reductions in total consumption. This “peak impact” could still occur alongside a growing population, but it would require larger efficiency gains.
Q: How is the world population expected to grow this century?
The United Nations and other organizations publish projections of how the world population could change in the coming decades. The UN’s median projection shows the world population growing to 9.7 billion by 2050 and 11.2 billion by the end of the century (see Figure 5). The high and low ends of their prediction interval suggest population is likely to be somewhere between 9.3 and 10.2 billion by 2050.

The UN and IIASA arrive at different population projections because of the different assumptions underlying their statistical models. In both models, most of the population growth this century will occur in less developed countries, mostly in Sub-Saharan Africa, where the demographic transition has not progressed very far.
The UN projections are slightly more pessimistic about the pace of demographic transition in Sub-Saharan Africa, which produces a higher projection. They base this assumption on evidence that fertility declines in Sub-Saharan Africa are occurring more slowly than other countries did at similar stages of development.13 They concede, however, that their median projections may be too high “should massive efforts to scale up family planning information, supplies and services be realized.”13
IIASA’s projections assume a slightly faster pace of fertility decline in Sub-Saharan Africa. They argue that the stalls in fertility decline observed there are likely to be temporary, delaying the demographic transition by only 5 or 10 years. The IIASA model also includes education as a third demographic dimension alongside age and sex. They argue that including this additional dimension, which has such strong predictive potential for fertility and mortality levels, increases the accuracy of their projections compared to the UN.
Q: Can we expect peak population this century?
Although the general drivers of fertility declines are known, demographers cannot know for sure if today’s high-fertility countries will follow historical patterns.6 However, governments and civil society can play a very active role in creating policy that impacts fertility rates, both directly, through family planning programs, and indirectly, by promoting economic development more broadly. Lowering fertility rates is far from the only reason to advocate for poverty reduction, access to education, and the empowerment of women.
There is a lot of uncertainty about how the world population will change this century, but there is plenty of cause to be optimistic. Both the UN and IIASA median projections see fertility rates declining in all high-fertility regions by 2050. Indeed, the only regions with any projected growth in fertility rates are wealthy countries where birth rates are much lower than replacement. Whether at 9 or 11 billion, continued efforts to promote human development could help the 21st century see the world population peak and start to decline.
Photo Credit: Stylepantry.com
1. Waggoner, P. E. & Ausubel, J. H. A framework for sustainability science: A renovated IPAT identity. Proc. Natl. Acad. Sci. 99, 7860–7865 (2002).
2. FAOstat database (accessed 2/29/16).
3. Kastner, T. et al. Global changes in diets and the consequences for land requirements for food. PNAS 109, 6868–6872 (2012).
4. Espenshade, T. J. et al. The surprising global variation in replacement fertility. Popul. Res. Policy Rev. 22, 575–583 (2003).
5. National Research Council (2000), Beyond Six Billion: Forecasting the World’s Population. National Academies Press, p. 44.
6. Lutz, W., Butz, W.P., and KC, S. World Population and Human Capital in the Twenty-First Century. Oxford University Press (2014).
7. National Research Council (2000), p. 90.
8. Gates, M. Gates Foundation Annual Letter (2014). “Myth Three: Saving Lives Leads to Overpopulation.”
9. Jain, A. K. & Ross, J. A. Fertility Differences Among Developing Countries: Are They Still Related to Family Planning Program Efforts and Social Settings? Int. Perspect. Sex. Reprod. Health 38, 15–22 (2012).
10. Cohen, Joel E. How Many People Can the Earth Support? New York: W.W. Norton & Company, Inc. (1995).
13. United Nations Department of Economic and Social Affairs. World Population Prospects: Methodology of the United Nations Population Estimates and Projections. United Nations Econ. Soc. Aff. XXXIII, 1–66 (2015).