What is the role of climate change in rising severe storm costs in the US? Part 2
The costs of severe storms are rising, but is this due to climate change or something else?
-
-
Share
-
Share via Twitter -
Share via Facebook -
Share via Email
-
Welcome back to our two-part series on the role of climate change in economic losses from severe storms in the US. In Part 1, I noted that while we see large increases in economic losses from severe thunderstorms, there are not documented increases in tornadoes or hail, which are the hazards responsible for those losses. This discrepancy suggests that changes in assets exposed to those hazards are primarily responsible for rising losses. In this post, I’ll look at the magnitude of the influence of climate change on severe thunderstorms and compare that to the magnitude of changes in the amount of stuff (and its value) exposed to severe thunderstorms.
Fundamental Theory and Mathematical Models
Just because we haven't seen clear historical trends in tornados or hailstorms doesn't mean that warming is having no impact. It just means that so far, the effect is small enough that it can be buried in the noise of natural variability. So, in order to assess the effect of warming on the direction and magnitude of change in these hazards, researchers rely on fundamental theory and mathematical models.
Studying severe thunderstorms using climate models is particularly challenging because they are actually smaller than the resolution of the models and, thus, are not directly simulated. Because of this limitation, studies often rely on more indirect evidence. Specifically, research will often use fundamental theory on the ingredients for severe thunderstorms and look at how these ingredients have changed historically or in climate models driven by increases in greenhouse gasses.
Fundamental theory tells us that severe thunderstorms require many ingredients, but at least two are particularly important. One is something called Convective Available Potential Energy, or CAPE, and the other is called wind shear. Convective Available Potential Energy is, just as it sounds, a measure of how much energy is available in the atmosphere for a storm to tap into. Wind shear is the change in wind speed or direction as you move up in the atmosphere, and it is an important ingredient for storms to develop rotation. You need a lot of both ingredients to get the “supercells” that are responsible for the longest-lived and most severe tornadoes and hailstorms.
When we look at the historical changes in these ingredients, we don't see much change, which is consistent with the lack of change in reporting-bias-adjusted tornado and hail reports.

However, models consistently predict that Convective Available Potential Energy will increase with warming. Wind shear is more uncertain, but the general expectation is that it will stay the same or potentially decrease.
Some studies have run climate change experiments using mathematical models with high enough resolution to explicitly simulate changes in supercells. The figure below shows the simulated difference in supercell counts per year (represented by a measure called UH) between the historical time period and 2100 (under around 3°C of global warming).

They show decreases over the Great Plains and upper Midwest and increases in the South. Overall, they simulate a 7% mean increase in supercell counts and a 5% mean increase in supercell hours in 2100, but variability is very large, as seen by the large confidence intervals (which represent the range across different years in the simulation).

Given the relatively small impact of long-term warming relative to natural variability (small change in the mean relative to the width of the confidence intervals), it is not surprising that we haven't seen the signal emerge from the noise in historical trends so far. Nevertheless, the balance of evidence seems to suggest that a warming climate will be more conducive to severe thunderstorms.
This wouldn't necessarily translate into an increase in hail, however, because hail melts in warmer temperatures. Essentially, the aforementioned increase in Convective Available Potential Energy should increase the updrafts that are necessary for hail formation, so we should expect to get more hail formed in clouds. However, that hail will fall through a warmer atmosphere and be more likely to melt into rain on the way down. So, which effect wins out? It is uncertain and depends on location and season. There are definitely some locations and seasons where the latter effect should win out. For example, one study shows that hail events mostly become nonexistent in future summers in Colorado. A variety of studies have indicated that drier and cooler regions in North America will experience the largest increases in hail threat, while warmer and more humid regions will experience a reduced threat.
Exposure and vulnerability
So, changes in the hazard of severe thunderstorms and their sub-hazards are small to date and, for most measures, are expected to be on the order of 10% or less this century. What, then, explains the very large changes in economic losses from these events?
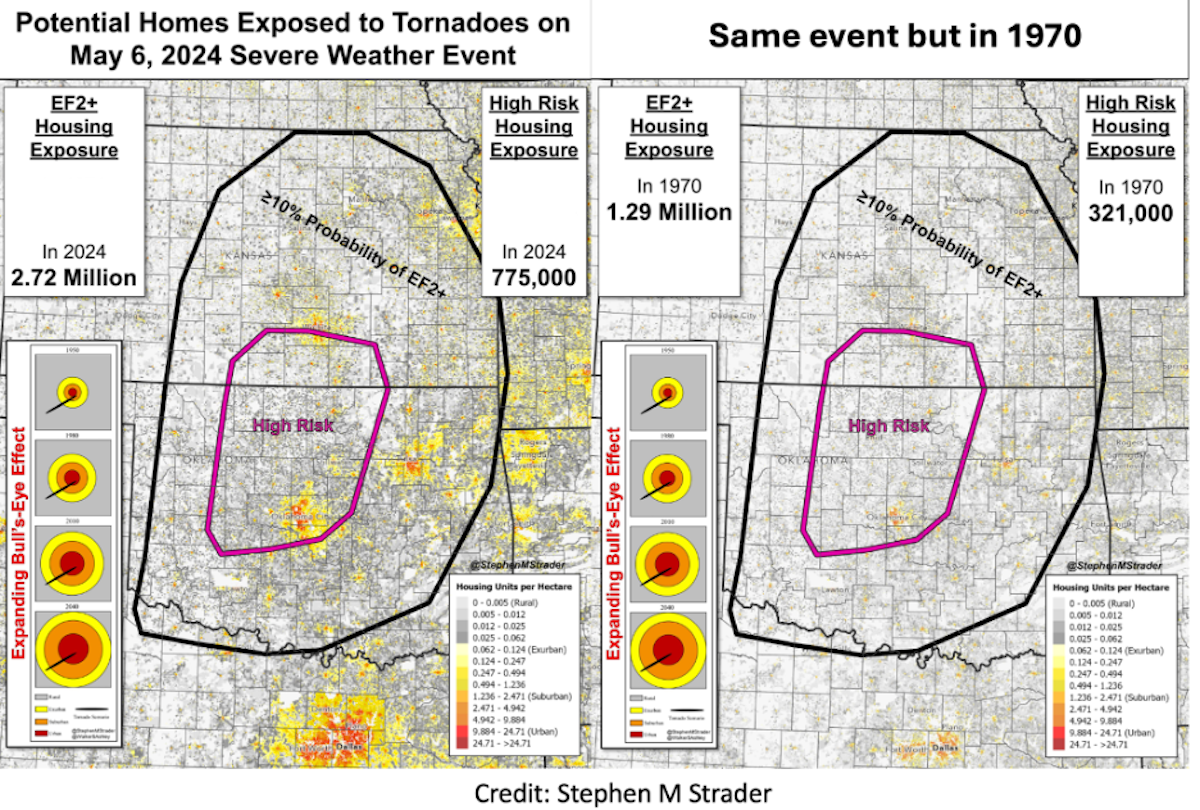
In the long term, the expanding bullseye effect that I emphasized in the flood series is a big part of the story.
Stephen Strader provides great examples of this. Below is a recent risk map of severe weather from this spring, in which 775,000 housing units in Oklahoma and Kansas were exposed to a “high risk” of a tornado (right side). But, the exact same risk map would have only included 321,000 housing units (41%) had it been issued in 1970.
That’s a specific example, but it generalizes. Systematic studies that encompass larger regions of the country and longer time periods reveal the same phenomena. Below is the number of structures per square km in tornado hotspots, showing an increase from about 2 structures per square km in 1940 to about 10 structures per square km today—a fourfold increase! These increases in exposure to severe weather hazards are much larger than any change in severe weather hazards themselves and thus are the dominant driver of trends in economic losses.

The insurance industry confirms as much. In its recent report on the matter, for example, SwissRe says that the main drivers of increased natural catastrophe losses are increases in exposure due to economic and population growth and increases in the cost of construction (independent of general inflation). They say, "So far, the impact of changing climates has been small."
An interesting finding from the SwissRe report is that hail is responsible for most (50-80%) of the insured losses from severe convective storms, and a key driver of increased losses from hail is increased vulnerability (in terms of the potential to incur monetary damage) in the form of increased solar installations. Again, it is not at all clear that the hail hazard has or is expected to become worse with warming. So, what is in the way of hail and how much it costs to replace it, makes a big difference.
Similarly, the insurance company Aon had a recent report that breaks down changes in exposure into gross domestic product (GDP), fixed reproducible tangible wealth, property cost inflation, and population distribution in high-hazard zones.
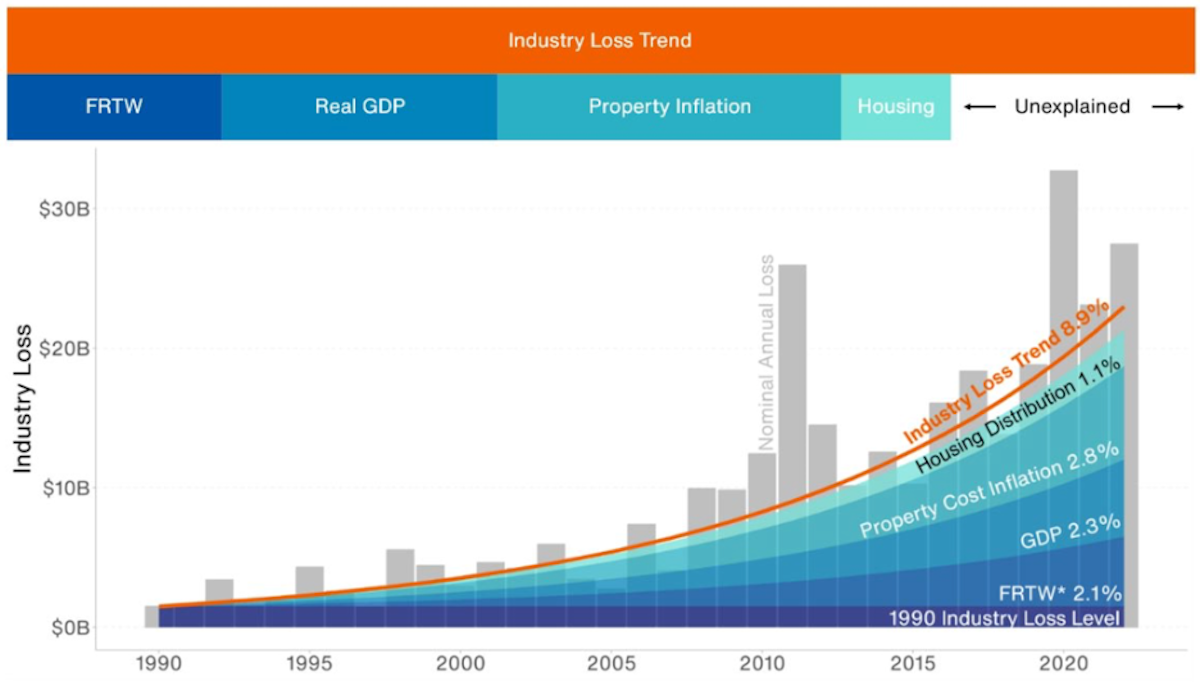
These four components grew at rates of 2.3, 2.1, 2.8, and 1.1% per year, which would absolutely dwarf any type of climate change signal in tornadoes or hail. Overall, they found that changes in value exposed account for 93% of the overall change in economic losses from severe convective storms (8.3% per year compared to the loss trend of 8.9% per year). Aon found that the remaining 7% in loss is unexplained and could be partially attributed to climate change.
It is worth noting that in terms of monetary losses, a great deal of the effect is due to the value exposed and the cost of reconstruction rather than the population exposed. This is part of the reason why fatalities from tornadoes, for example, have seen a long-term decline.

Essentially, there are many more people in harm’s way than ever before, but we are better protected, warned earlier, and better prepared for severe weather than we ever have been, which has been driving down deaths.
To conclude, we see large increases in economic losses from severe storms, but economic loss data cannot be used to infer changes in severe storms themselves. This is because the economic loss data is heavily influenced by changes in the value exposed and vulnerability of assets. When examining historical trends in tornadoes and hail over the US, we observe little change (as detailed in Part 1). However, looking to the future, we expect environments conducive to severe weather to become more common, but these changes are relatively modest, on the order of 10%.
In contrast, the changes in exposure—often referred to as the "expanding bullseye effect"—are an order of magnitude higher or more. This significant increase in exposure underscores that the rising economic losses are more a function of where and how we build rather than the frequency or intensity of the storms themselves. Therefore, the tendency of certain media outlets to attribute these increased losses primarily to climate change can be misleading.
The takeaway is that while climate change does play a role, emissions reductions will be an incredibly inefficient lever in the fight against rising economic losses from severe storms. Instead, we should focus on managing exposure and reducing vulnerability in high-risk areas. This involves better planning, stronger building codes, and more effective disaster preparedness.

