Is Economic Growth Coming to an End?
How Robert Gordon Misreads the Data and What It Tells Us About the Dismal Science
-
-
Share
-
Share via Twitter -
Share via Facebook -
Share via Email
-
Over that past month there has been much discussion of a new paper by Robert Gordon, a prominent economist at Northwestern University, which carried the provocative title: Is US Economic Growth Over? Faltering Innovation Confronts the Six Headwinds.” (See for instance, Annie Lowrey here, the Economist here and David Keohane here).
In what Tim Harford called “the summer’s most talked about working paper in economics,” Gordon argues that the economic growth of the past century may represent an aberration from the normal state of society, which experiences little economic growth. Look far enough back in time Gordon says and the world had minimal, if any economic growth, and looking ahead, we may be returning to that dismal state. Gordon explains that he is raising “the audacious idea that economic growth was a one-time-only event."
Over the past month I have taken a close look at Gordon’s paper, the data he relies on and the papers that he cites. My conclusions are that Gordon’s analysis is deeply flawed and tells us essentially nothing about the potential for future economic growth. It does help to reveal a big gap in the discipline of economics, and that is the utter lack of an explicit theory of growth and the mechanisms by which it actually takes place. What Gordon has provided, in his own words, is a “a provocative fantasy” one that tells us much about the discipline of economics but little about the state of the world.
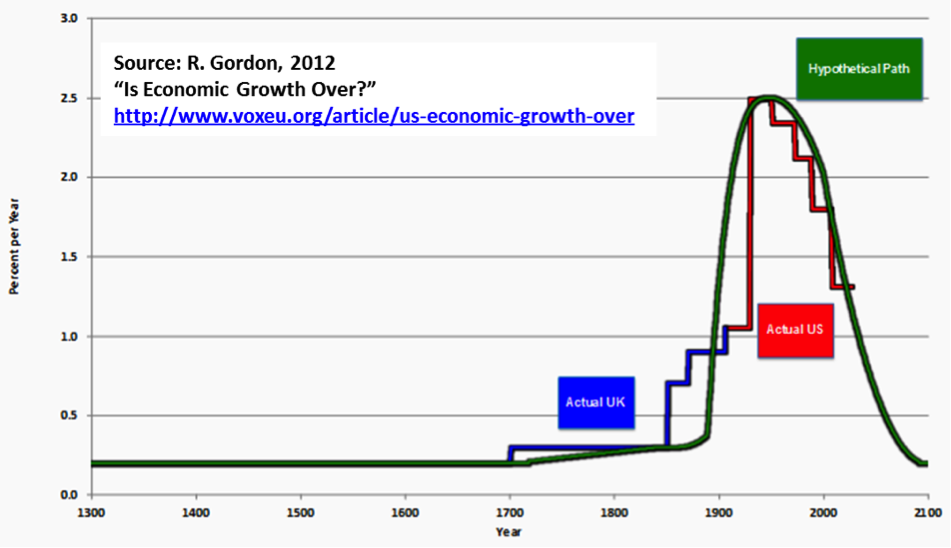
Gordon’s argument is summarized in the figure below (source). Gordon begins by looking at long-term per capita GDP growth in the United Kingdom, which he characterizes as the historical “frontier” and is shown in the graph by the blue curve. England experienced economic growth of 0.2% per year from 1300 to 1700. From this he concludes that “there was almost no economic growth for four centuries and probably for the previous millennium.” The period from 1700 to 1870, Gordon explains, had a faster rate of economic growth, 0.48% per year.
The red curve appended to the incrementally increasing blue curve picks up when the United States arguably took over as the “frontier” growth economy (in 1906) and shows a dramatic increase in per capita GDP growth followed by a steady decline. Overlaid on the UK and US data is the green curve representing Gordon’s “provocative fantasy” which illustrates the long-term baseline of very little growth punctuated by a twentieth century of anomalous growth rates, followed but a return to very low rates of economic growth.
For historical estimates of economic growth in the United Kingdom, Gordon relies on an excellent paper by Broadberry et al. (10 January 2011, here in PDF). Below I have graphed the data on UK economic growth from Broadberry et al. in comparison to Gordon’s simplification of that same data.
Looking at the actual UK data on growth at the resolution provided by Broadberry et al. shows a different picture than the single value presented by Gordon.

The data show great variability in per capita economic growth over the 600 years. A notable feature of the time series, which went unmentioned by Gordon, is the great stagnation in per capita economic growth in the century following the “Black Death” starting about 1350. The population of England dropped from about 4.8 million to 2.8 million from 1348 to 1351, and dropped further to 1.9 million over the next century. Despite this near-apocalyptic devastation, per capita economic growth recovered and then accelerated.
From Broadberry et al. we should conclude that rather than being “nonexistent,” economic growth is actually a remarkably robust feature of human societies that is difficult to stop – even the plague could not do it. The figure below shows overall economic growth, population and per capita economic growth for England from 1270 to 1700, from Broadberry et al. The graph clearly shows the impact of the Black Death on population and GDP, but remarkably, by 1700 the average British citizen was 2.5 times wealthier than his ancestor of 400 years earlier. Economic growth was far from “nonexistent” during this time.

Not only did economic growth result in an increase in general wealth, but it changed the very nature of the British economy. Broadberry et al. document that agriculture shrunk from 49% of all economic activity in 1400 to 27% by 1700, while industry and services increased their relative shares by 41% and 47%, respectively. This broad economic change was the result of systematic improvements in agricultural productivity – for instance, from 1270 to 1700 wheat yields per acre increased by 62% and milk production per cow by 272%.
In short, Gordon’s reading of the historical record certainly qualifies as “provocative fantasy” as it misses an impressive record of economic and productivity growth during a historically trying period. But what about Gordon’s interpretation more recent history of 20th century economic growth?
Here Gordon argues that economic growth accelerated in the first half of the 20th century and then, “Each of the successive periods after 1950 exhibits a downward step in per-capita real GDP growth, with steps downward marked at 1964, 1972, and 1987.” The final step is not data but a forecast that Gordon made in 2007 by Gordon. (Gordon’s data is shown in the red curve in the first graph above).
I have sought to replicate Gordon’s analysis through 2006 (i.e., when it relies on data) following up his reference to NIPA Table 1.1.6 (I used version of 29 Aug 2012) and data on US population from the US Census. I also took a look at the standardized GDP data produced by the late Angus Maddison (presented in PPP dollars), which is referred to by Gordon throughout his paper. These results are shown in the graph below. [UPDATE: The Maddison data shows the growth rate of the previous 10 years. The annual data is graphed here. There are no implications for the analysis in this post as the data is the same, but the chart is mistitled. Apologies.]

In short, there is no evidence of a stair step reduction in the growth rate of US per capita GDP in either dataset. The US BEA and Census data shows essentially no change (a linear trend, blue line, shows a statistically insignificant downward tick) whereas the Maddison data shows a bit of an increase (red line). The data is sensitive to the time period chosen – for instance, from 1970 the BEA/Census data shows an increase in the annual rate of per capita GDP growth. I can find no evidence of a post-1950 secular decline in per capita economic growth in the United States, and in fact, there is evidence that growth rates have accelerated a bit from 1970.
For a bigger picture representation, here is a long view in US per capita GDP, courtesy of VisualizingEconomics.com, which is consistent with the analysis presented here.

The fact that Robert Gordon’s exercise in “provocative fantasy” has been the most discussed paper in economics over the recent summer tells us a lot about the discipline of economics – at least how it is received in the public sphere – and much less about growth and the economy. There may indeed be “headwinds” working against growth, but they won’t be discovered by simplistic curve fitting and ad hoc theorizing.
An important lesson that we should take from history is that economic growth is a remarkably robust process having endured for centuries, and repeatedly transforming the world we live in. But Gordon is right about one thing, continued growth is not a guarantee. If we are going to make decisions that contribute to sustaining growth we will have to understand why growth happens, how to sustain it and what actions we can take to capitalize on and share its benefits while working to mitigate its negatives. This sets forth an agenda that the discipline of economics has yet to fully engage. Provocative fantasy is no substitute.
Photo credit: Flickr user Stuck in Customs