The Bottom Line on iPhones vs. Refrigerators
The Cloud Begins with Coal" Author Responds to His Critics
-
-
Share
-
Share via Twitter -
Share via Facebook -
Share via Email
-
It’s uncontroversial to note that the global information-communications-technology sector (ICT) uses a lot of electricity. But convert that observation into a per capita form, illustrated, for example, by how many kilowatt-hours an iPhone might use, and protests and invectives sprout up faster than windmills in Iowa.
In response to our new report The Cloud Begins with Coal: Big Networks, Big Infrastructure, Big Power, some in the media got the point, but others seized on the comparison between an iPhone and refrigerator’s annual energy use and made claims of cherry picking and questionable assumptions. It should be obvious -- though apparently not for some -- that we are not talking about the few kilowatt-hours (kWh) a year needed to recharge the battery inside an iPhone, iPad, or their equivalents.
The relevant energy used by a smartphone comes from the entire ICT infrastructure that makes mobile broadband possible and instantly available. When everything in the ICT ecosystem is accounted for, one finds that a single iPhone or tablet can easily use – or more properly, cause to be used – at least 400 kWh per year. That’s roughly the same as a high-efficiency residential refrigerator.
Before unbundling the specific assumptions and data that lead to the surprising iPhone-refrigerator convergence, there is an easy sanity check as to whether such an outcome is reasonable. One can simply, and somewhat simplistically, divide the widely published figure of 1,000 billion kWh for global ICT electric use1 by the world’s nearly three billion Internet-connected devices, which yields about 330 kWh per year as an average electric use per device. That’s close to a refrigerator. Of course an average means some devices use a lot less, some a lot more energy. An average also doesn’t reveal critical trends seen in a device-specific estimate of the unique “fuel cycle” of a smartphone or tablet.
Accounting for the fuel cycle of a networked computer, whether stationary or mobile, is unlike that for any other consumer product. Using a single car, for example, does not require dozens or hundreds of other cars all over a city to be constantly idling, and then rev up the instant you start driving. This is precisely what happens with a networked computer. Surf the Internet, check Facebook, or watch a video, and while the handheld device starts to draw down its battery, computers all around the country and the world light up nearly simultaneously.
Where iPhones and cars are similar, however, is in accounting for the energy required to produce the silicon and steel components, respectively (amortized over the product lifespan), and in how energy use depends on behavior. The equivalent of accelerating hard and driving fast in the Internet ecosystem is watching video on a tablet.
How exactly do people drive their smartphones and tablets? From there one can make an estimate not only about the electricity a single iPhone causes to be used, but the implications for future energy demand.
Mobile Broadband Changes The Game
Wireless network architecture, hardware, and energy use was originally configured primarily for voice and similar data-light tasks like texting. That network is now necessarily undergoing radical change to accommodate the data deluge from smartphones and tablets. Voice traffic dominated the mobile network until 2010. Network traffic for voice use has changed little for years and is now essentially irrelevant. Cellular network traffic is utterly dominated by data, up 400-fold since 2007. That date is no coincidence; it marks the iPhone’s introduction.
A recent industry survey revealed what nearly everyone knows anecdotally, if not personally, regarding how smartphones are used. Time spent watching video is already approaching the time an average smartphone is used for simple phoning.
Average User’s Daily Activity on A Smartphone
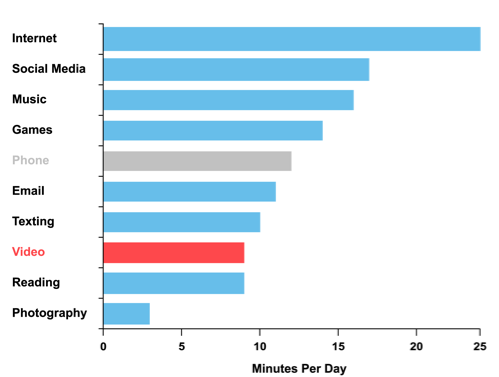
Data Source: Telefónica UK Survey 2012
While phone calls, texts, and emails consume at most a few MB per month per user, data use rises a thousand-fold to the GB level when watching video, browsing the Web, or keeping up on social media. The average traffic for smartphones already approaches the GB per month level, and for mobile PCs (which now migrate to tablets), average data use rises to several GBs per month.
Average Monthly Traffic Per User Smartphones & Mobile PCs

Data Source: Ericsson Mobility Report: On The Pulse of the Networked Society, June 2013
For our representative exploration of the electrical ‘exhaust’ of driving an iPhone or iPad reasonably hard, we consider someone watching one high-definition video per week. Per Netflix, an HD video is 2.8 GB/hr, which totals 145 GB annually. (Note that this is, perforce, higher than the average in the above survey, but today’s heavy user becomes tomorrow’s average user.)
Now we need to know two things – the embodied energy in the form of the annualized electricity to manufacture the iPhone or tablet, and the electricity used per GB in the networks.
Network Energy Use
Most of the attention focused on ICT energy use has been directed at the staggering, warehouse-scale data centers. Individual data centers can consume as much electricity as a small city, and collectively global data centers use nearly as much electricity as the country of England. But data centers likely account for only one-fifth of the total global electricity associated with ICT. And on an electricity-per-bit basis, data centers are incredibly efficient. While actual efficiency is proprietary, an average of about 0.1 kWh/GB is found in the technical literature. Thus, the 145 GB per year consumed by our representative iPhone yields only 15 kWh/yr at data centers.
The activity on the wireless broadband networks is what makes the mobile Internet possible.2 As with data centers, facility information is usually proprietary, and the electricity consumption per bit also depends on location, especially the age and type of equipment. Estimates of cellular energy found in the technical literature range widely from 0.1 to 19 kWh/GB.
For the purpose of our representative calculation, we use the lower end of the range: 2 kWh/GB.3 This leads to about 300 kWh per year for a smartphone or tablet using 145 GB on cellular networks.
Embodied Energy
Annualized embodied energy is calculated by dividing the total energy used to manufacture a product by its lifespan. Information equipment is uniquely energy-intensive to manufacture, and has a far shorter useful life than most other manufactured goods. Refrigerator lifespans run 10 to 15 years, cars a decade, but smartphones typically last three years. Some surveys find the average mobile phone is replaced every 18 months.
Thus while some estimates put the annualized embodied energy for a tablet at nearly double that of a refrigerator, for the purposes of our calculation we use a more conservative estimate (below) of about 100 kWh per year.
Annualized Energy Cost of Manufacturing Equipment vs. Product Weight
[ Average lifespan in (years) ]

Data Source: A Tool to Estimate Materials and Manufacturing Energy for a Product, MIT, 2009
There is more to the embodied energy cost than we are accounting for in our simple illustration here. Network equipment also has embodied energy; semiconductor fabrication accounts for roughly half of cell tower’s embodied energy. It takes about five years before the cumulative operating energy for a cell tower equals the embodied energy. As technology accelerates, and wireless operators scramble to upgrade networks with the newest most efficient equipment, the lifecycle of network equipment shortens. The result is to simultaneously reduce operating energy use while increasing embodied energy use.
Embodied vs. Operating Energy For A Cellular Base Station

Data Source: “Rethinking energy efficiency models of cellular networks with embodied energy,” Network IEEE, March-April 2011. Embodied energy accounted for 25% of a cellular network’s total life-cycle energy use in 2005 and grew to 43% by 2007.
The Bottom Line
For the sake of simplicity we ignore embodied energy in the upstream infrastructure. When you add the 100 kWh/yr for the smartphone’s embodied energy to 15 kWh/yr from data centers and the 300 kWh/yr in the wireless networks, you get a total of 415 kWh per year, or, roughly the same as a high-efficiency residential refrigerator.
As mentioned earlier, if the smartphone is used only for phone calls and texting, it will use less electricity. If it is used to do more than watch a video weekly, from social networking to web browsing and file sharing, then the energy used rises substantially. This is particularly true if the smartphone is used in geographic regions where, typically, slightly older network equipment is in use. Per device energy use can easily approach that of two refrigerators.
And in the future? Smartphones and tablets will use less electricity per GB. But if forecasts of traffic and behavior are correct, the GB consumed per smartphone and tablet will rise far faster than gains in efficiency. Furthermore, as the world migrates towards one refrigerator per household, it also evolves more rapidly towards several smartphones and equivalent per person.
Mark P. Mills is CEO of Digital Power Group, a tech and investment advisory, and a Senior Fellow with the Manhattan Institute. He coauthored the book The Bottomless Well, and has a forthcoming book on Big Data.
1. A widely reported 2012 Greenpeace study estimated the global Internet (loosely, the “Cloud”) used 600 billion kWh in 2007. Greenpeace estimated that figure would triple by 2020, a growth rate that implies 1,100 billion kWh for 2013. A European Commission report published this year estimated 930 billion kWh for global ICT. Another recent report -- published last year and sponsored by 12 tech companies including Ericsson, Microsoft, Nokia, HP, Verizon, etc. -- yielded a number similar to the European Commission report. We note that in the interstices of all of the aforementioned reports, the data sources date back to 2010 and earlier, and in particular use network energy data circa 2007, before the rise of the smartphone and advent of the tablet. Our August 2013 report on global ICT electricity use -- where the Executive Summary sparked the controversy over the iPhone-refrigerator comparison -- found a higher figure of about 1,500 billion kWh. Our report used more recent data and, unlike other published work thus far, accounted for the very recent increase in wireless broadband as well as included other Internet connected devices, notably digital TVs.
2. We ignore in these calculations wired networks because mobile networks use 100 times more energy per unit of data.
3. At the low end of the range, for example, is a 2013 technical paper from University of Melbourne and Bell Labs estimating 0.1 to 0.2 kWh/GB for cellular broadband energy use. This range is based on the assumptions of a mixed use of local WiFi (to keep traffic off of the cell system) and utilization of the most efficient (not average) network equipment. At the other end of the spectrum, GSMA, the mobile operators trade association, has published a value of 19 kWh/GB in a 2013 paper, reported as a significant improvement over the 33 kWh/GB in 2009. An earlier 2005 technical analysis from Motorola, Swisscom, and Deutsche Telekom, provided 38 kWh/GB in 2004; this latter translates into 2.5 kWh/GB by 2013 based on the reported rate of improvement in network efficiency of 26%/yr. A technical paper from 2012 by Ericsson, Telecom Italia, Alcatel-Lucent, provides a range of 1 to 2 kWh/GB. Note: relevant to the exploration of energy use from wireless broadband, according to Verizon the latest high-speed 4G LTE cellular networks require two to three times more data traffic per hour to perform the same tasks as on the previous slower network.