How much did increasing “Climate Whiplash” impact the Los Angeles Fires?
“Climate whiplash” appears to be a larger advance in climate science marketing than in climate science.
-
-
Share
-
Share via Twitter -
Share via Facebook -
Share via Email
-
“Los Angeles is burning, and accelerating hydroclimate whiplash is the key climate connection.”
That was the first line of the UCLA Press Release on a recently-published Nature review paper Swain et al. (2025): Hydroclimate Volatility on a Warming Earth.
Thanks in no small part to the huge journalistic audience that lead author Dr. Daniel Swain commands, the “climate whiplash” vernacular was immediately adopted in international headlines covering the recent Los Angeles fires:
- The New Yorker: Climate Whiplash and Fire Come to L.A.
- ABC News: How hydroclimate whiplash contributed to the severity of California wildfires
- Newsweek: Why a Rain 'Whiplash' Is to Blame for Los Angeles Fires
- The LA Times: Intensifying climate ‘whiplash’ set the stage for devastating California fires
- The Guardian: Climate ‘whiplash’ events increasing exponentially around world
- Financial Times: Fire and floods: the rise of climate whiplash
- Grist: The ‘weather whiplash’ fueling the Los Angeles fires is becoming more common
This coverage is not entirely organic as organizations like Covering Climate Now—which advise journalists on how to frame stories through a climate lens—highlighted climate whiplash as a good talking point for the Los Angeles fires.
Regardless, the paper has demonstrated incredible reach and is in the 99.99th percentile in terms of online attention for all research (not just climate research) of a similar age.
But as is the case for so much high-profile climate science, there is a large gap between the impression conveyed by the coverage and the impression left from the observational data.
So what is “climate whiplash” and how much is it changing?
Dangerous, intense wildfires require dry vegetation. The idea behind the climate whiplash connection to the Los Angeles fires is that very wet winters in Southern California in 2022-2023 and 2023-2024 enabled a great deal of vegetation growth but that the very dry beginning of the 2024-2025 winter allowed that vegetation to dry out, resulting in a landscape primed for uncontrollable wildfires. Swain explains the mechanism in interviews with Adam Conover and Neil deGrasse Tyson.
The idea being conveyed is that these climate whiplash events are dramatically increasing not just in Southern California, but globally.
“Every fraction of a degree of warming speeds the growing destructive power of the transitions” Swain said.
Taking a step back, the fundamental theory undergirding changing “hydroclimate” (think water cycle where we are considering not just how precipitation provides moisture but also how evaporation takes moisture) whiplash is nothing new. It is a basic fact of atmospheric physics that a warmer atmosphere can “hold” more water vapor (about 7% more per °C of warming). This warming influence on the water cycle has been discussed in detail since at least the 1980s (e.g., Manabe, & Wetherald, 1986)). At first, most research discussed a general intensification of the water cycle, typically emphasizing that already dry areas would get drier and already wet areas would get wetter as the globe warmed. However, by the mid-2000s, studies like Trenberth et al. (2003), Chou & Neelin (2004), Meehl et al. (2005), and Held & Soden (2006) began pointing out that the same physics (warmer atmosphere holds more moisture) can drive larger variability in the same place—heavier rain events juxtaposed with prolonged and/or more intense dry spells.
These concepts are taught regularly as a part of Climate Change 101 classes, including my own, and they are accepted as consensus climate science, articulated with “high confidence” in the IPCC’s most recent assessment report:
“A warmer climate increases moisture transport into weather systems, which, on average, makes wet seasons and events wetter (high confidence)”
“Warming over land drives an increase in atmospheric evaporative demand and the severity of droughts (high confidence).”
However, I like to point out that it is useful to break down lines of evidence in climate science into categories of
1) Historical observations/trends
2) Fundamental theory
3) Mathematical modeling
I know from teaching the “wet gets wetter, dry gets drier” concept that the evidence for increased variability in the same location is much stronger in the theory and modeling categories than it is in observations. This is important because observations should take precedence over the other two. Focusing on observations tells us a lot about how big of an effect we’re talking about (i.e., do we see major trends emerge through the noise of the observation system and natural variability?). Furthermore, a fundamental point of doing science is to explain observations. The canonical order of operations is that first you observe some phenomenon, and then you use the tools of theory and modeling to make sense of it.
Observations of year-to-year water cycle variability
So, let's privilege “observations” of water cycle variability. I put the word observations in quotes here because it is more appropriate to think of the available datasets as highly processed products that incorporate observations rather than thinking of the data itself as pure observations. The starting point for the Swain et al. (2025) analyses (what they end up calculating their whiplash metric on) is something called the Standardized Precipitation Evaporation Index (SPEI), which is a highly processed unitless drought index that incorporates both precipitation and potential evaporation from the Earth’s surface to account for the net balance between the two.
One issue with interpreting SPEI as “observations” in this context is that the “dry gets dryer” mechanism is actually built into the calculation of the index from the outset (evaporation is not measured directly but calculated to increase with increasing temperature). Therefore, using the SPEI to “observe” that dry times get drier as they warm is technically committing the logical fallacy of begging the question where the premise of an argument assumes the truth of the conclusion.
Leaving that issue aside, let’s look at “observations” of annual variability because that is what is most relevant to the Los Angeles fires. Also, unlike in Swain et al. (2025), I’ll restrict the analysis to the land surface because that is where impacts are relevant (as exemplified by Fig. 1 in Swain et al. (2025)). It’s not particularly consequential if deluges only increase over the ocean, and the entire motivation to look at net water cycle variability using the SPEI is that the land surface can dry out—we are not worried about drying out the ocean surface.
Swain et al. (2025) use two input datasets in their calculation of SPEI, but I’ll focus on the ERA5 dataset since it is widely considered to be the gold standard for global analysis of most climate variables after the year 1950. First, let’s look at climate whiplash events exactly as they are defined in Swain et al. (2025).
Below is the occurrence of all whiplash events and just wet-to-dry whiplash events in the grid box closest to where the Eaton Fire in Los Angeles originated, directly from the Swain et al. (2025) published data.
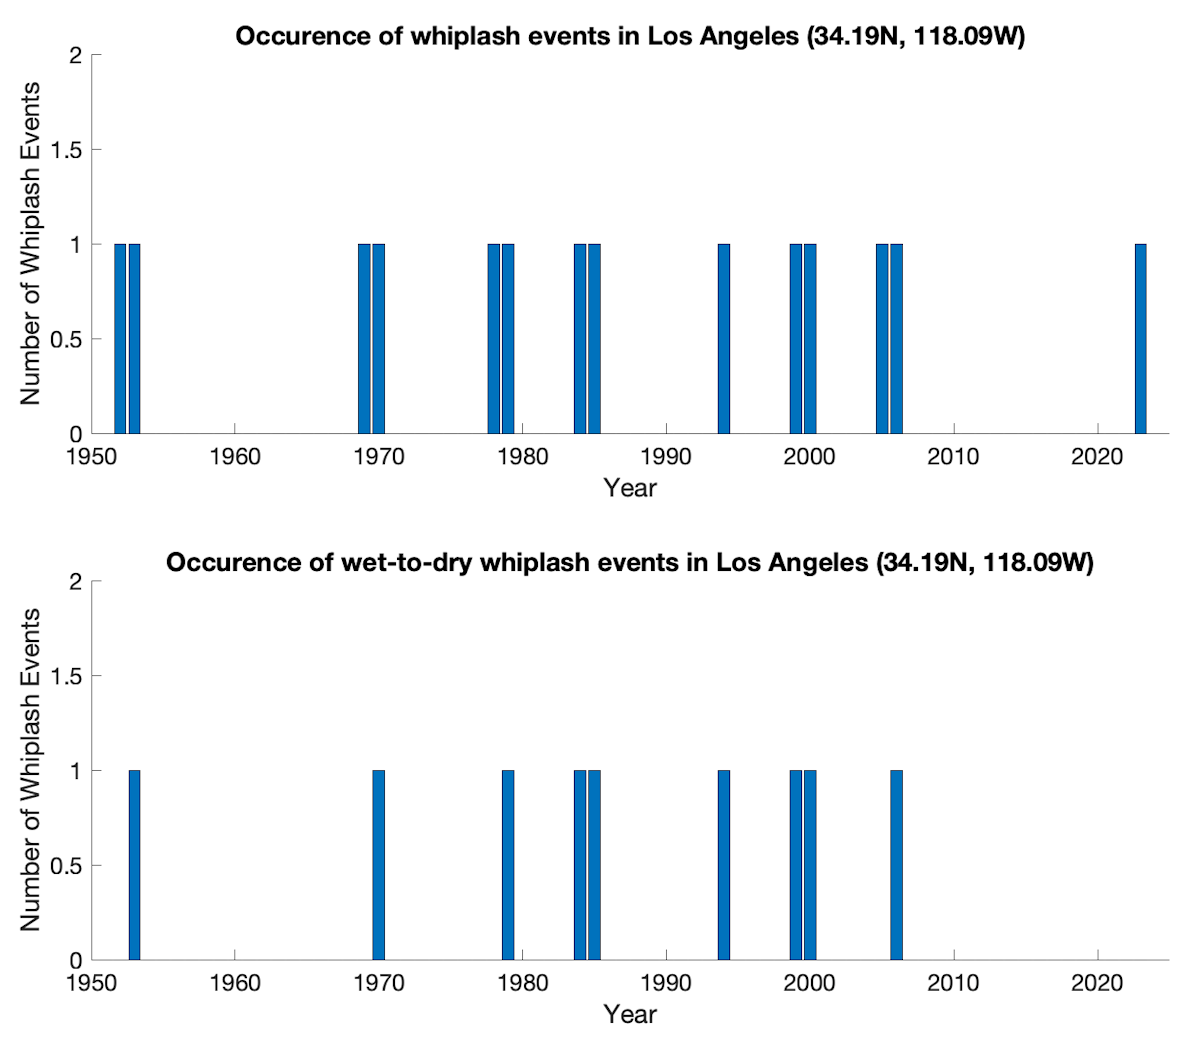
That’s not exactly compelling evidence for a major increase. But these events are rare (and thus noisy), so to aggregate over more data, let’s look at the frequency of occurrence over a larger area. Below is the fraction of land in a larger region over southern California that experienced annual wet-to-dry whiplash events.
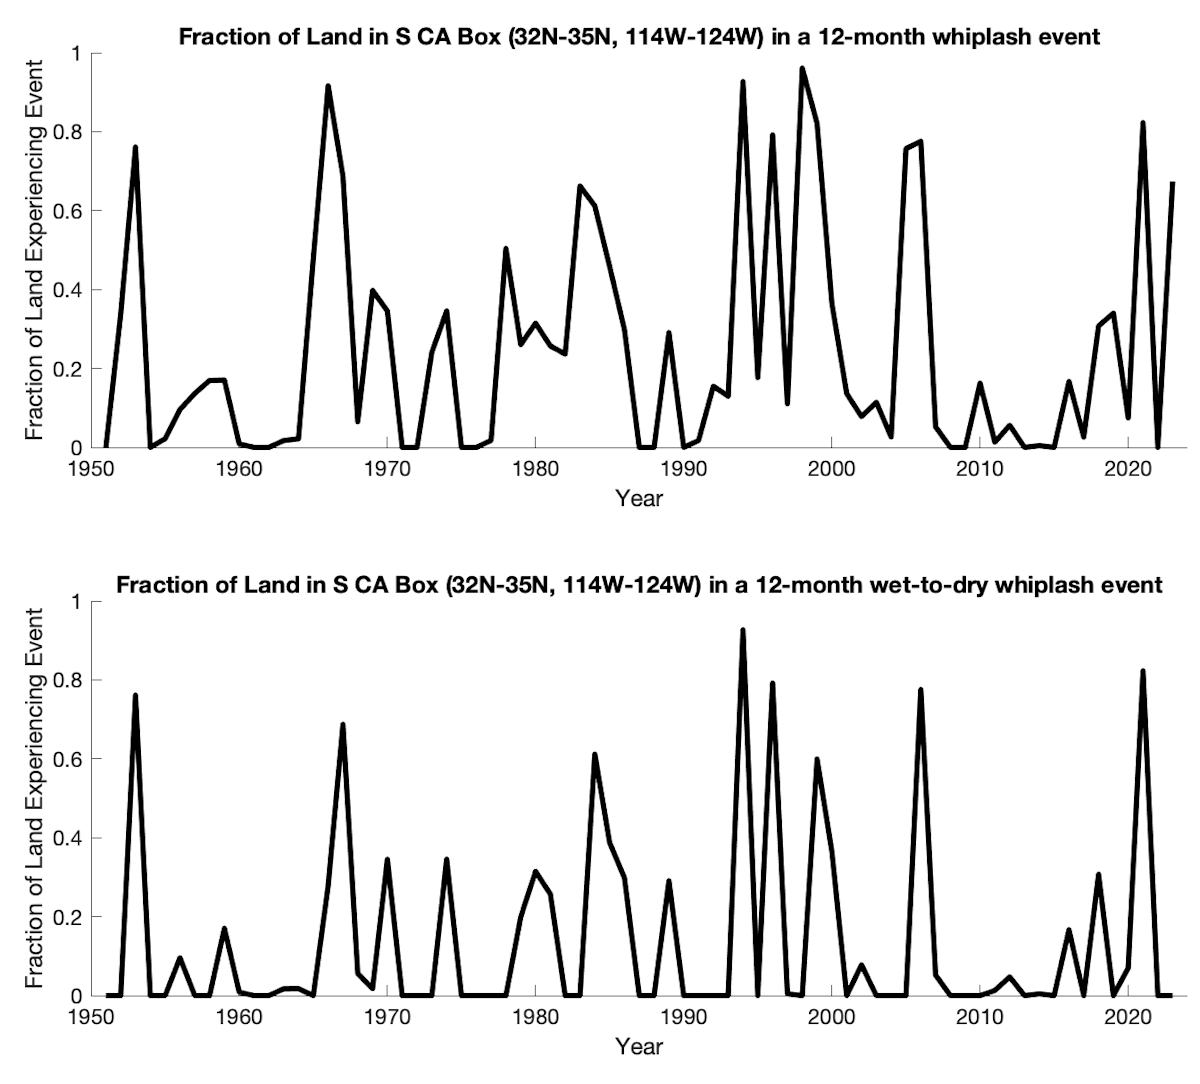
Still, not exactly compelling evidence for a major increase. So perhaps it was a stretch to try to shoehorn the results of the paper into the news cycle around the Los Angeles fires, but are the results still compelling globally? Below is the change in overall whiplash frequency of 12-month whiplash events between the first and most recent 30-year time periods over land using the ERA5 dataset.
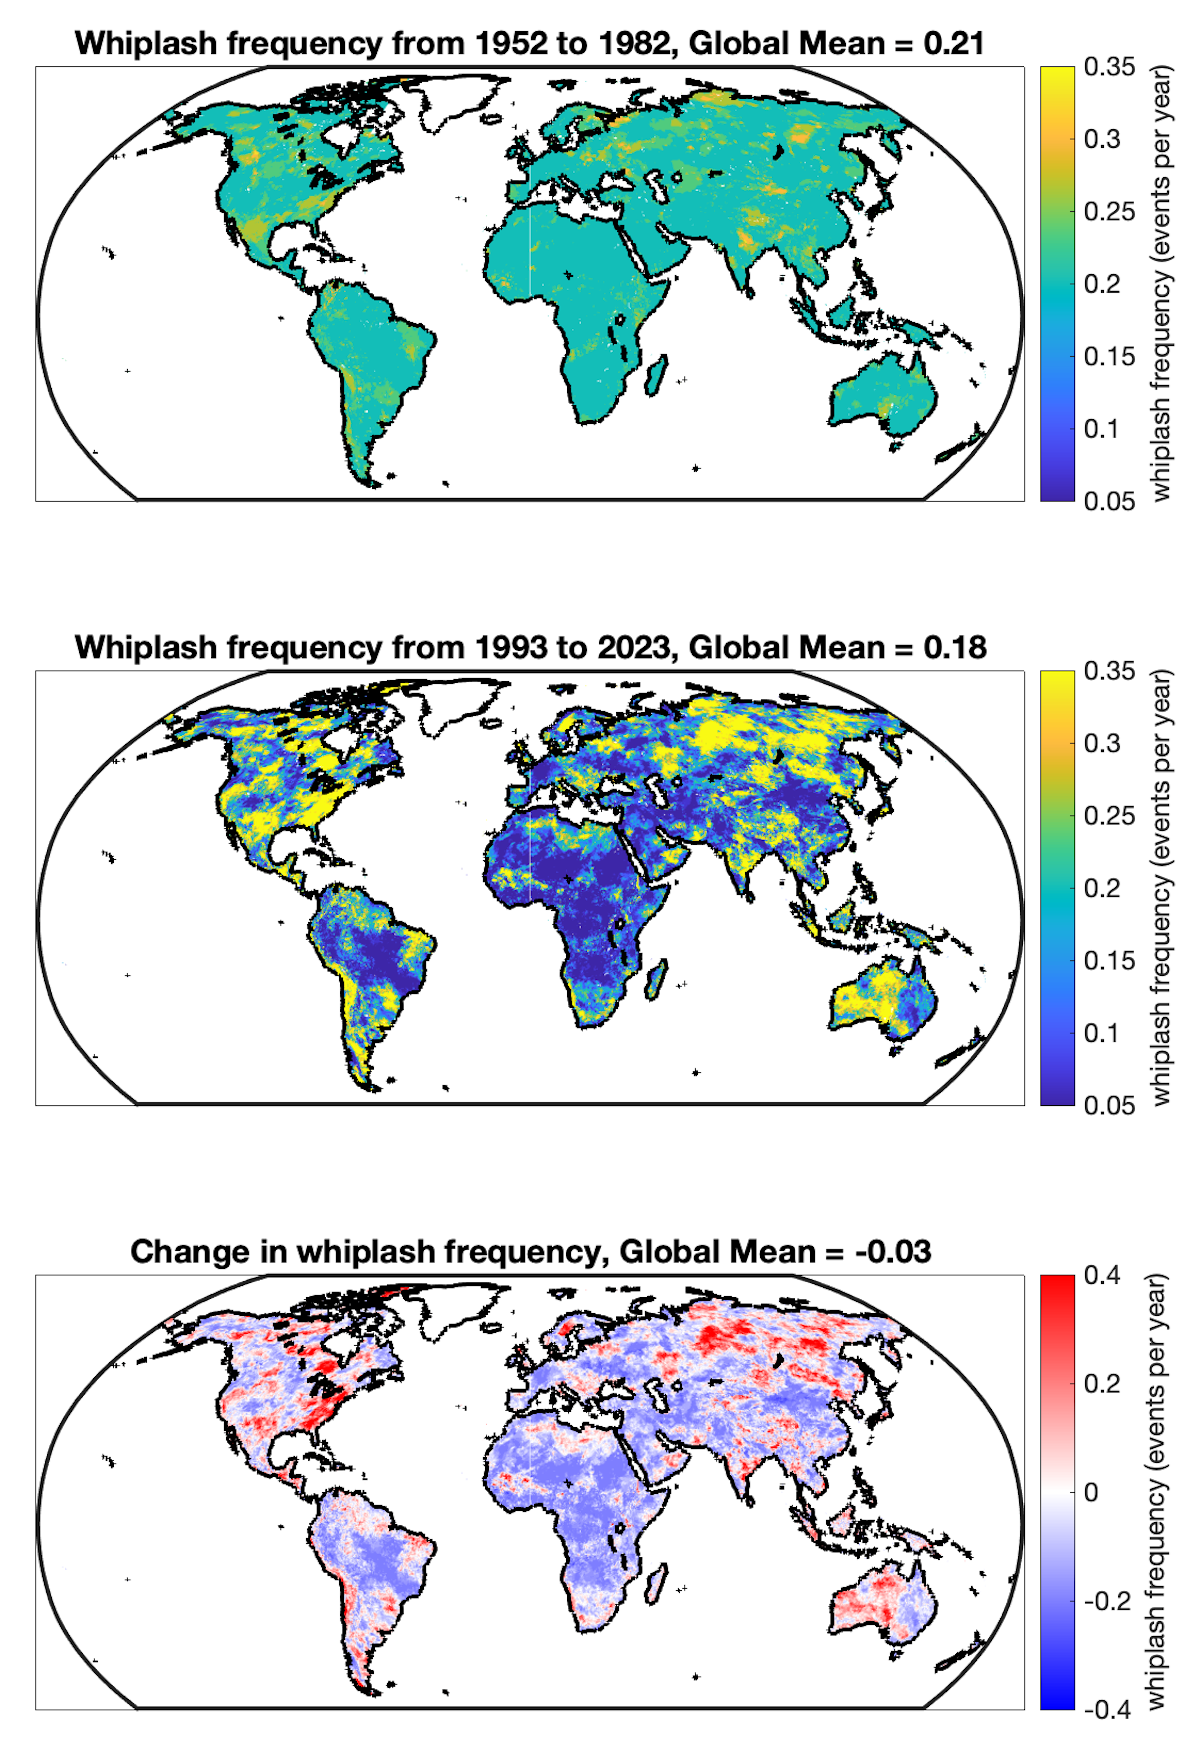
So, over all global land, at the timescale that is most relevant to the Los Angeles fires (annual), in the premiere observational dataset (ERA5), using Swain et al. (2025)’s own data, we have seen a long-term decrease in whiplash frequency (this, by the way, is acknowledged in passing in the text of Swain et al. (2025) on page 37).
Let’s pause for a second to recall the first line of the UCLA press release (“Los Angeles is burning, and accelerating hydroclimate whiplash is the key climate connection.”) and the global news coverage it generated. Would any reader of this coverage have any idea about the incredibly important caveats above? Not that I can tell.
How large are changes in annual water cycle variability?
Now, to be fair, Swain et al. (2025) purport to show evidence of increasing whiplash frequency at multiple timescales, spatial extents (over the ocean, for example), and in other datasets.
However, highlighting changes in arbitrarily-defined “event” frequency without reporting changes in “event” magnitude is misleading, and it goes against one of the core recommendations of the National Academies of Sciences 2016 report on Attribution of Extreme Weather Events in the Context of Climate Change. As Ted Shepherd recently put it in his presentation to the committee responsible for the next such report: “Frequency is the more impressive number, but magnitude is perhaps the more physically interpretable number.”
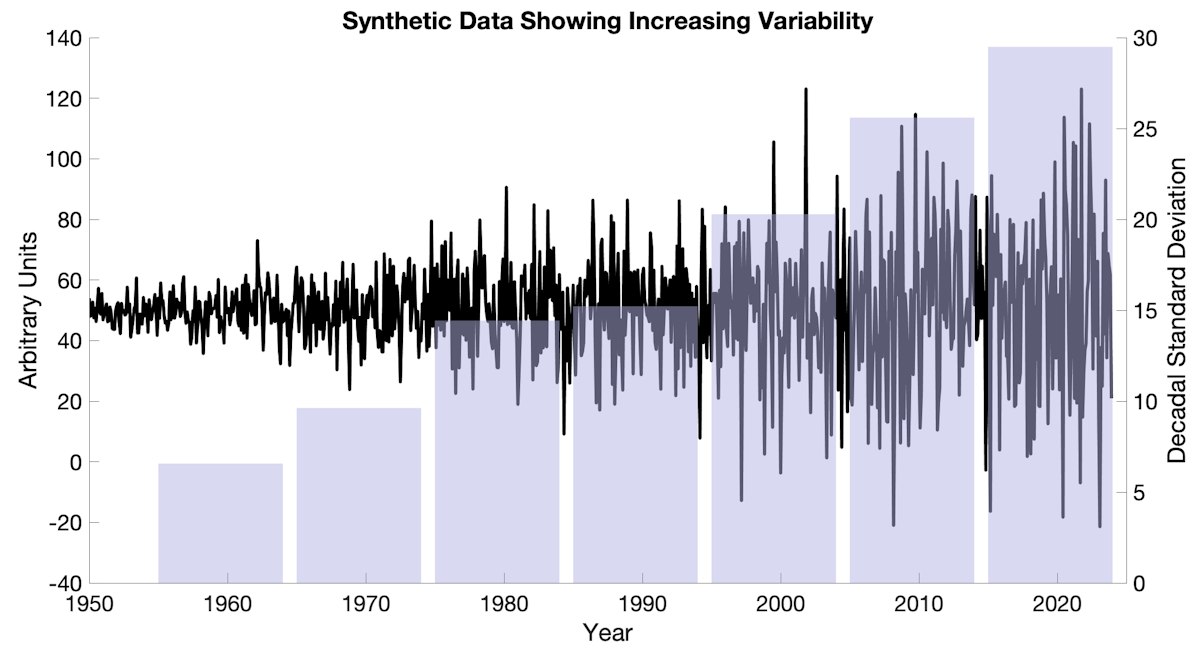
So, let’s look at how large these changes in water cycle variability are (i.e., changes in magnitude) using the most conventional measure of the magnitude of variability, the standard deviation.
Below is a demonstration of what we might see if variability was dramatically increasing (i.e., what is conveyed by the coverage of the climate whiplash study). The black line is data with increasing variability (left y-axis), and the light blue bars are the standard deviation of that data for each decade (right y-axis). Whiplash events technically require swings to be very close in time but overall variability and whiplash frequency are clearly related.
Swain et al. (2025) do not provide the SPEI data that they calculate their whiplash metric on (they do provide code), but preprocessed SPEI datasets exist. Using this already-available dataset, below is the change in annual (SPEI12) variability, looking specifically at the grid point closest to Los Angeles.
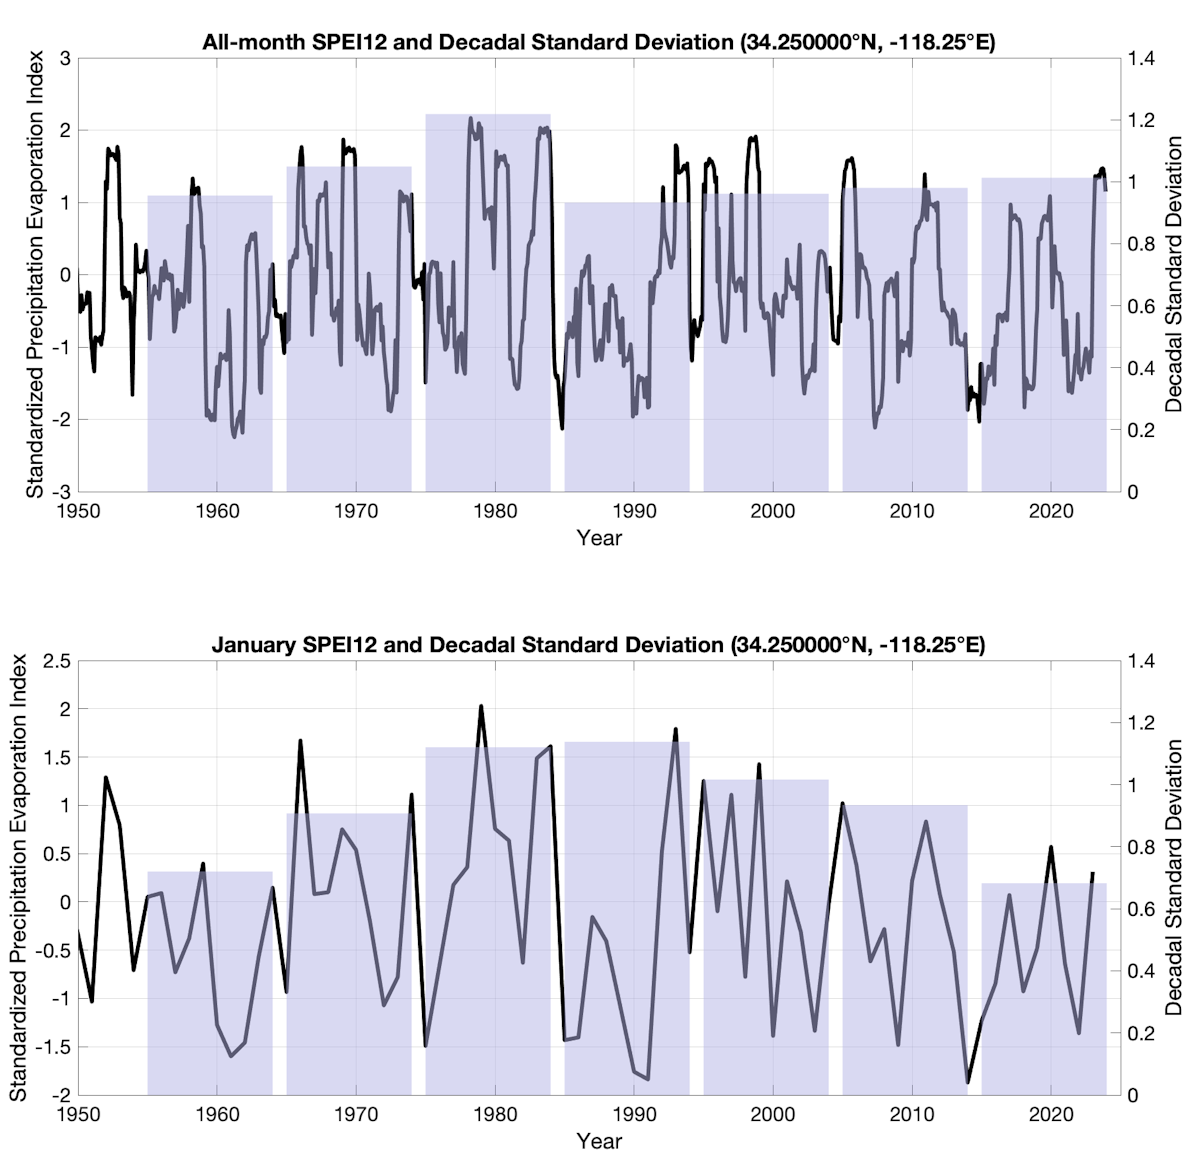
So again, we see no long-term increase in water cycle variability at the location and timescale relevant to the Los Angeles fires.
Below is the same change in annual SPEI variability but over the entire land surface.
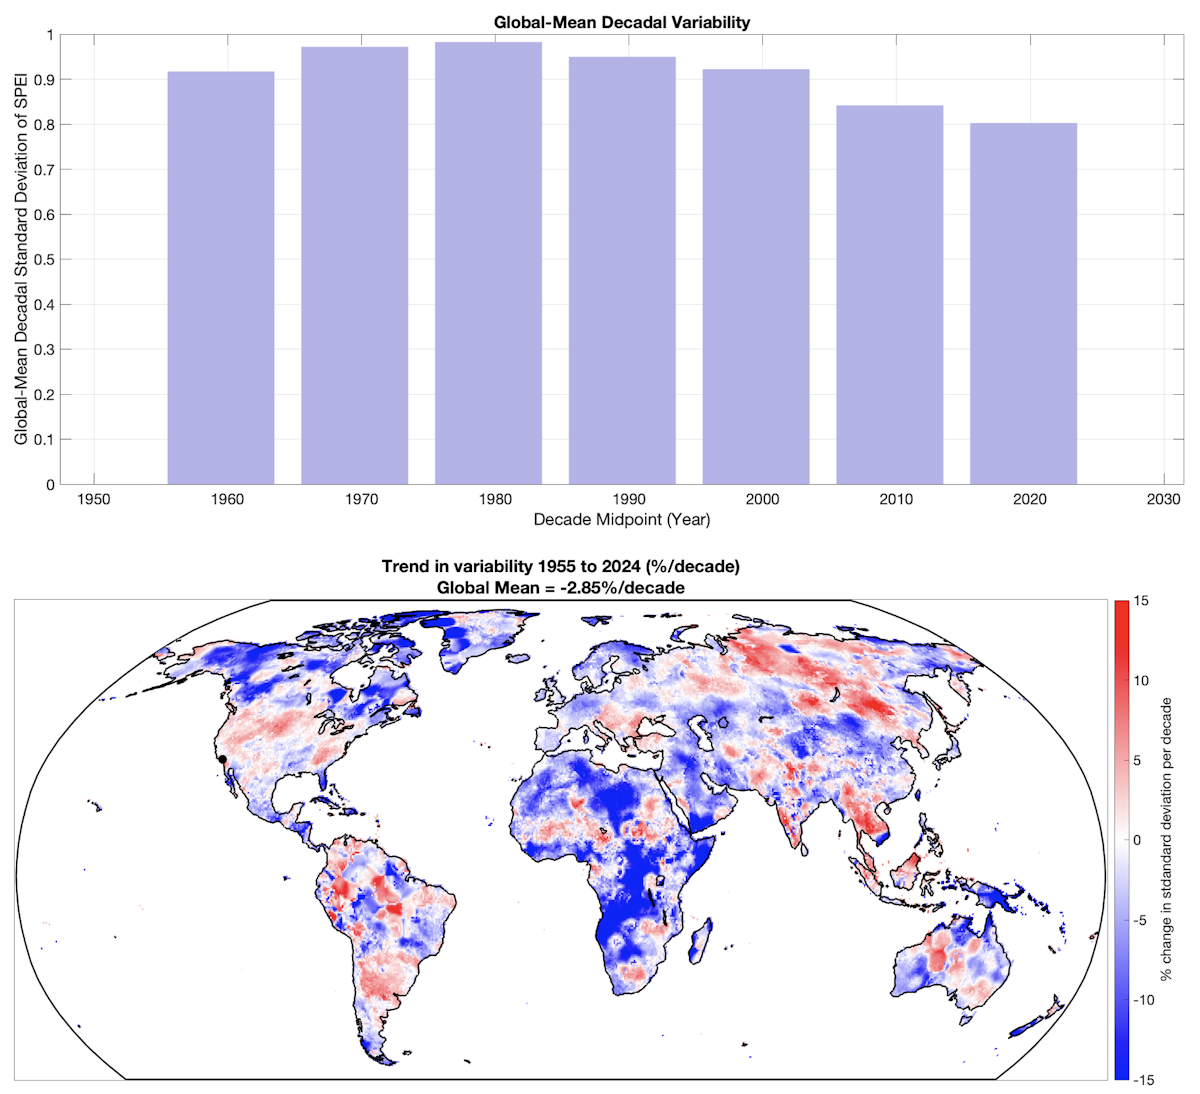
Rather incredibly, we have seen an overall decrease in annual scale water cycle variability (quantified using SPEI12) over global land since the 1980s.
How large are changes in annual precipitation variability?
Unfortunately, it is still difficult to interpret changes in the magnitude of SPEI variability because it is a unitless index. So, to get a better intuition of changes in water cycle magnitude variability using something with physical units, let’s look at the change in annual precipitation variability.
Changes in precipitation variability differ from the specific whiplash metric used in Swain et al. (2025), but using annual precipitation variability is certainly in line with how the research was presented and received. For example, in the context of the Los Angeles fires, prominent climate scientist Andrew Dessler cited the whiplash research when saying, “We are confident that climate change is making rainfall more variable.”
Uncertainty in global precipitation “observations” is quite large because of changes in the spatial footprint and/or density of the underlying rain gauge observations, the introduction of new satellite data or retrieval algorithms over time, uncertainty stemming from models used to calculate precipitation, or statistical uncertainty associated with the extrapolation to locations without observations. Because of these issues, many groups have created different observational datasets with different methods and assumptions. They generally attempt to create more-or-less homogenized data with continuous records over as large a spatial area and as high a spatial resolution as possible, but they all come with a laundry list of caveats. (precipitation is just one input into the SPEI calculation, so all these caveats apply to the SPEI calculations above as well).
Regardless, if the change in variability was large, you'd hope to see it manifest in climate science’s conventionally-used precipitation datasets. Below is the annual precipitation and its variability in eight such precipitation datasets for the Los Angeles region (the closest non-ocean grid point to the Eaton Fire in each dataset).
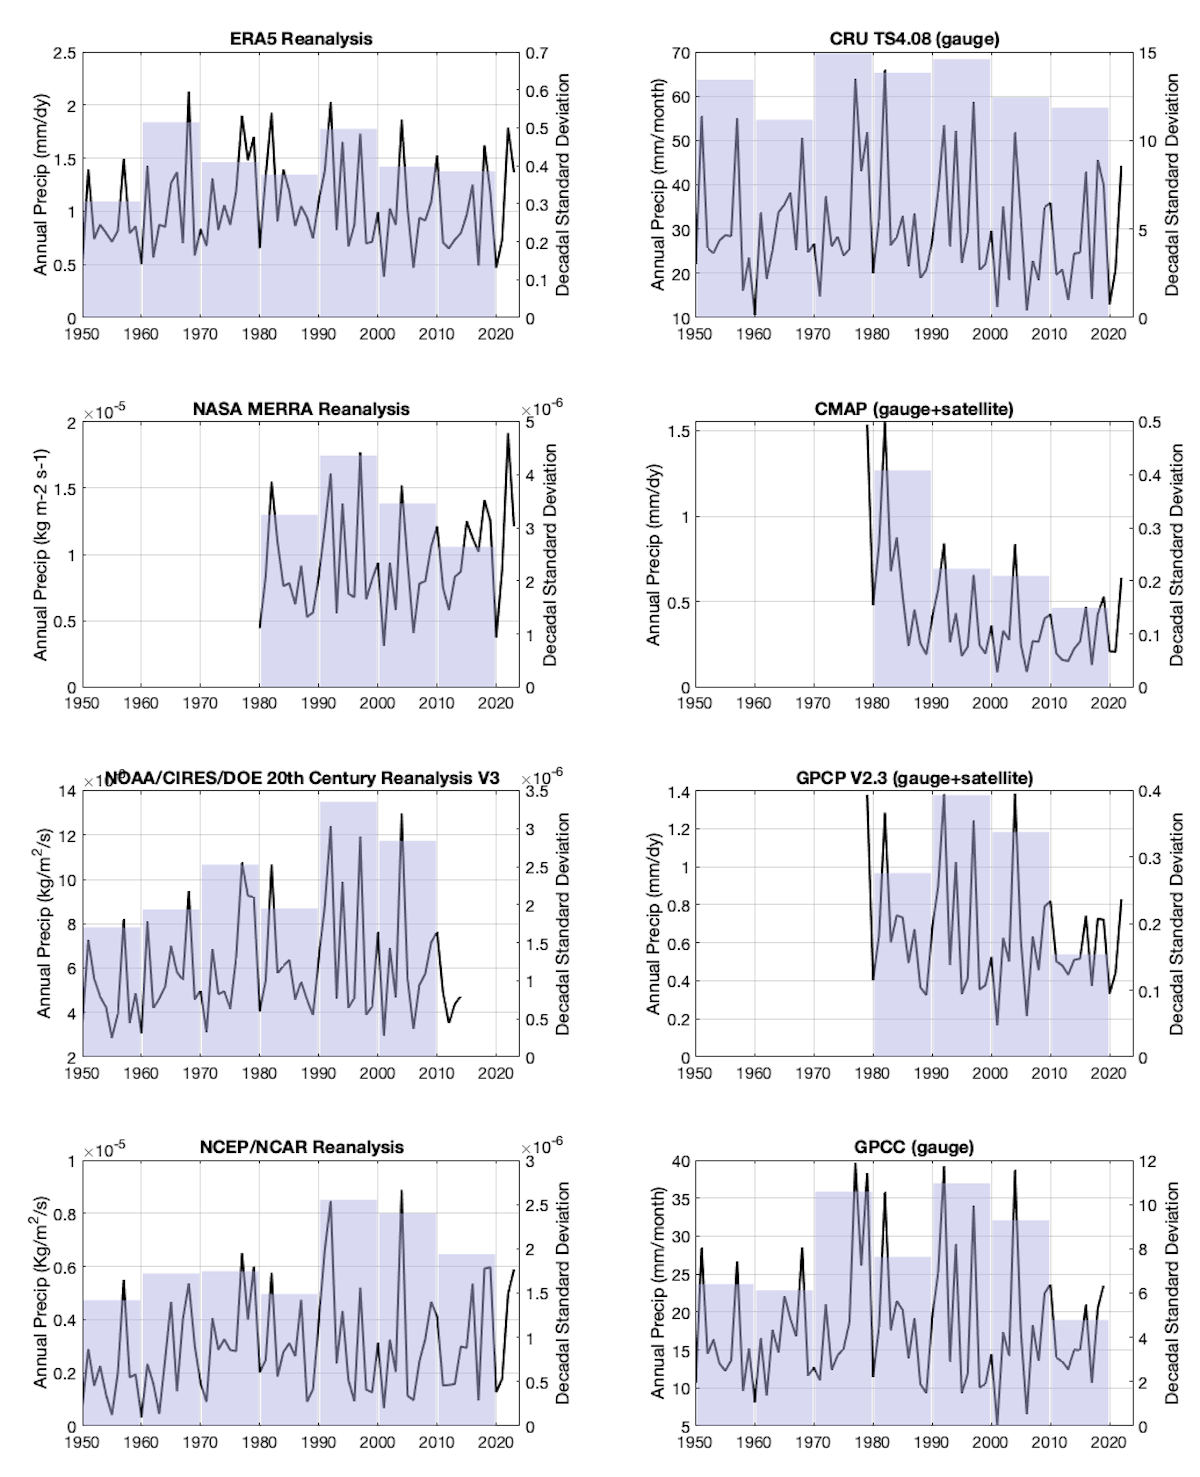
Forget “how large is the magnitude of change;” we see no coherent evidence of increased annual precipitation variability over Los Angeles in the first place.
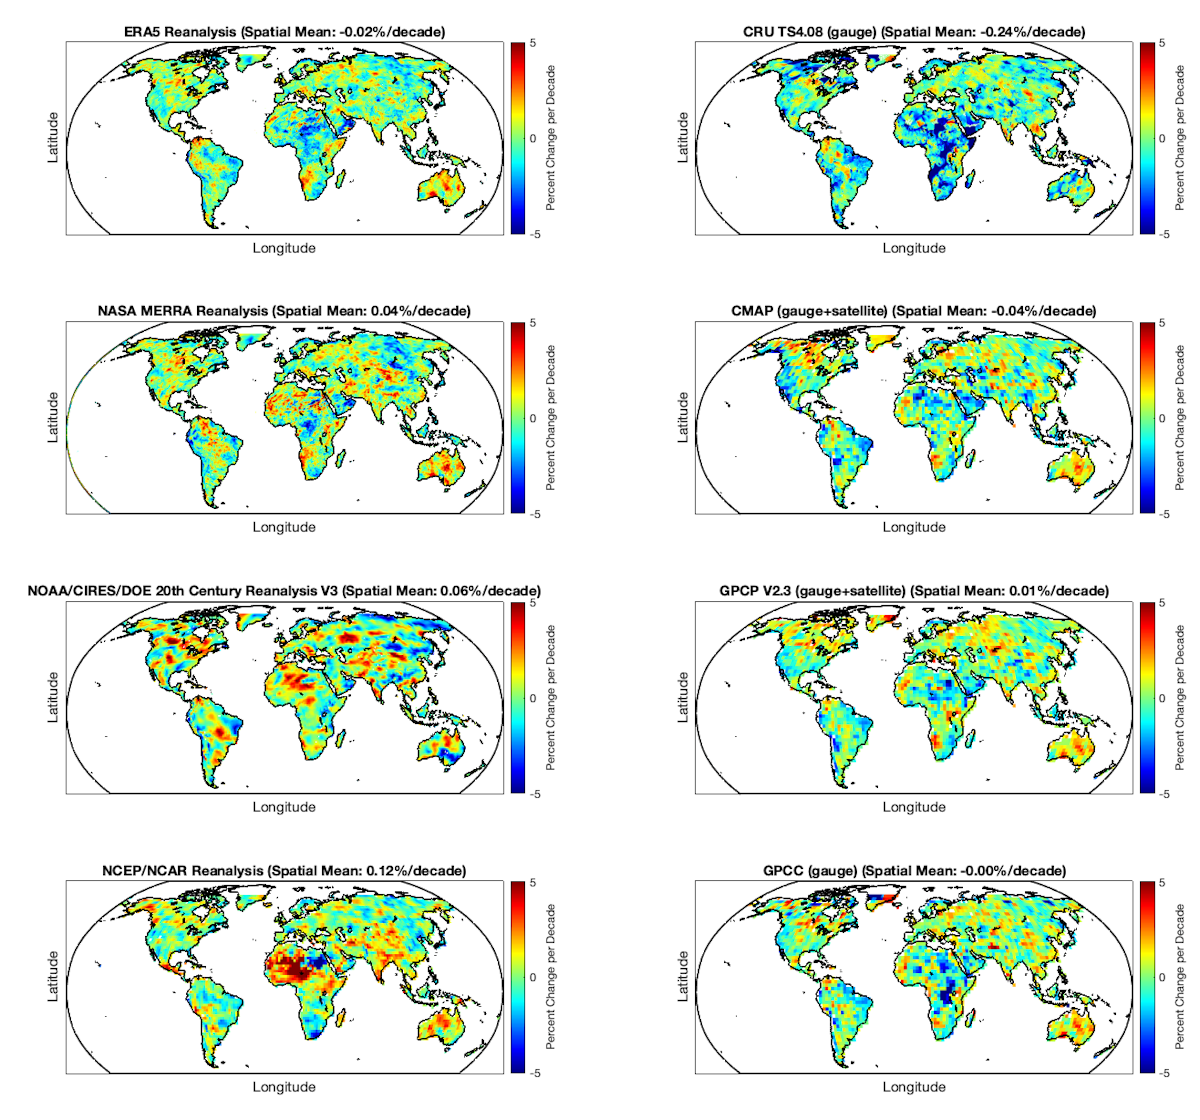
But again, Swain et al. (2025) was about global changes. Below are global maps of change in annual precipitation variability (expressed as percent change in local standard deviation per decade) for the same datasets since the 1980s.
And finally, below is the global average of the local rainfall variability for each decade.
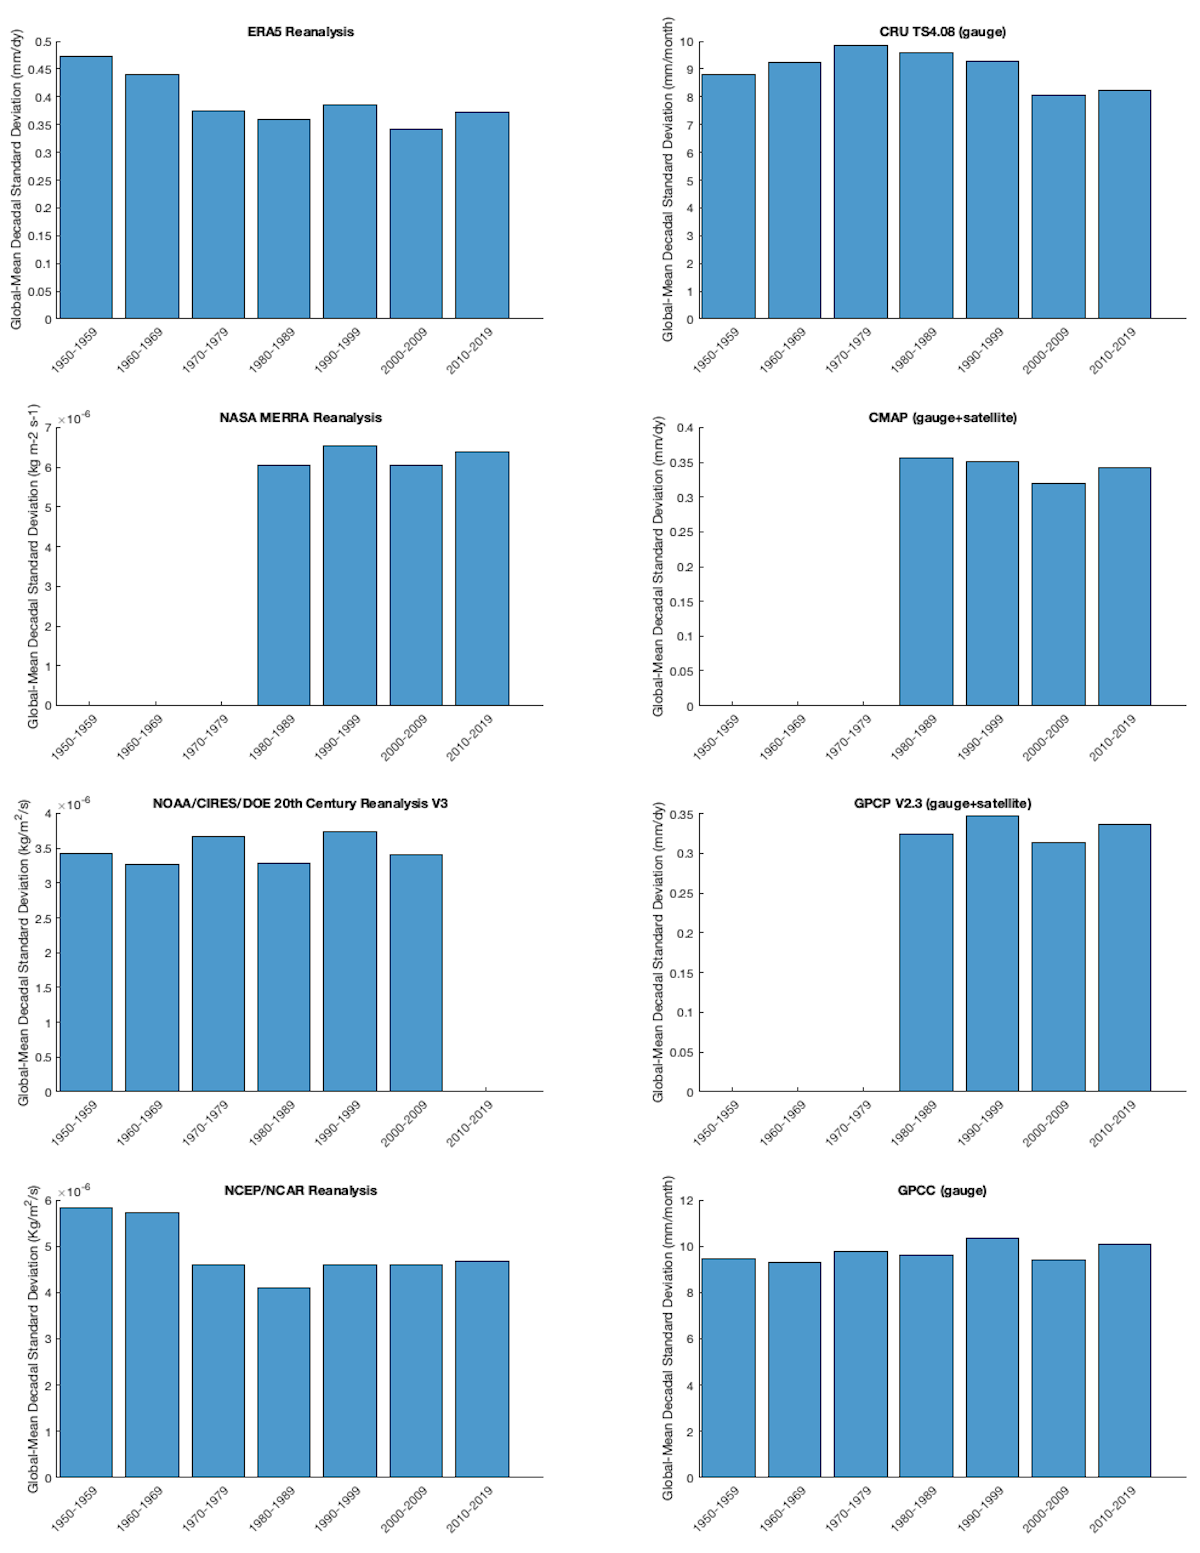
Again, discussing the change in magnitude is almost irrelevant when we see no coherent evidence of increased annual precipitation variability.
Summary
So, let’s recap. At the annual timescale that is most relevant to the Los Angeles fires…
- Figure 1: There is no clear increase in overall whiplash occurrence or wet-to-dry whiplash occurrence in Los Angeles in the premiere observational dataset (ERA5) using data directly from Swain et al. (2025).
- Figure 2: There is no clear increase in overall whiplash occurrence or wet-to-dry whiplash occurrence over southern California in the premiere observational dataset (ERA5) using data directly from Swain et al. (2025).
- Figure 3: There is a long-term decrease in whiplash events globally over land (where it matters) in the premiere observational dataset (ERA5) using data directly from Swain et al. (2025).
- Figure 5: There is no increase in the variability (standard deviation) of annual SPEI either for all months or centered on January) in the Los Angeles grid point using the pre-existing standard SPEI dataset.
- Figure 6: There has been a decrease in the variability (standard deviation) of SPEI over global land since the 1980s using the pre-existing standard SPEI dataset.
- Figure 7: There is no agreement on the direction of change (if any) in annual precipitation variability (standard deviation) over the Los Angeles area across eight different precipitation datasets.
- Figures 8 and 9: There is no agreement on the direction of change (if any) in annual precipitation variability (standard deviation) globally across eight different precipitation datasets.
While “climate whiplash events” may be increasing in frequency under most of the very specific, selected definitions used and datasets investigated in Swain et al. (2025), the general idea that annual precipitation (or more generally, the water cycle, which includes evaporation) is becoming dramatically more variable is not supported when a broader set of datasets and definitions are used.
Would a reader of Swain et al. (2025), or especially its coverage, have any idea about the weakness of its broader conclusions or the lack of robustness of its results to different definitions and datasets? Almost certainly not, and I contend that this is a major problem for public understanding and trust in climate science.
Why don't we see a robust increase in water cycle variability given the strong theory underpinning “wet gets wetter, dry gets drier”? For one thing, the theoretical size of the effect is known to be quite small relative to natural, unforced variability, making it inherently difficult to detect. For example, we see in Figure 7 above that year-to-year rainfall in Los Angeles naturally varies by as much as 300%, yet the signal we are looking for is one to two orders of magnitude less than this. It is also apparently the case that observational uncertainty is larger than the signal (or there would not be such disagreement between datasets). Physically, perhaps increasing mean precipitation is offsetting the increase in calculated evaporation in the SPEI index, reducing its variability. Maybe reduced temperature variability (via arctic amplification) is reducing calculated evaporation variability.
I don’t know the full answer, but these would be great research questions to identify and outline in a Nature review like Swain et al. (2025). Unfortunately, Swain et al. (2025) missed this opportunity because the paper seemed so focused on assembling evidence in favor of increasing water cycle variability that contradictory evidence was never presented or seriously grappled with.
My main discomfort with Swain et al. (2025) and its rollout is that it appears that the primary goal was to create and disseminate the “climate whiplash” meme rather than conduct a truly rigorous evaluation of the evidence, including countervailing evidence. Ultimately, this makes the research a much larger advance in marketing than an advance in science.

