What Does Exposure Growth Look Like?
Insights from Hurricane Prone North Carolina
-
-
Share
-
Share via Twitter -
Share via Facebook -
Share via Email
-
Peak hurricane season seems to have everyone in the east and Gulf coasts on edge. Homeowners cringe at every new “formation” forecast and insurance professionals curiously watch the minutiae of every atmospheric hiccup over the Atlantic.
In all this, my current hometown of Wilmington, North Carolina provides an ideal window onto the complicated interplay between economic development, weather extremes, and America’s challenges with homeowners insurance costs.
In the United States, we care about the cost of homeowners insurance because we care about homeownership; if you can’t afford the insurance, then you can’t keep your mortgage. The housing sector accounts for about 16% of national GDP give or take, the state of the sector is a common indicator of the state of the U.S. economy. Although homeownership rates fluctuate, since the 1960s, over 60% of households are owner occupied.
Homeownership matters. Vice President Kamala Harris promised that if voters made her president come November, she would build three million new homes and hand out $25,000 in first-time-buyer down payment aid.

Seeing that homeownership seems unlikely to go out of style, the next consideration is balancing trade-offs between 1) affordable homeowners insurance and 2) sustainability of the insurance business in the face of increasing the amount of property exposed to weather extremes.
In my previous post, I emphasized the robustness of the finding that it is not climate change but exposure growth—the increasing presence of expensive infrastructure in vulnerable areas—that is the leading cause of weather related losses. Indeed, while the literature on extreme weather is nuanced, the IPCC finds no observed climate change signal in a long list of climate variables relevant for understanding debates about losses in the United States—including losses from hurricanes.
Yet those losses are still so often pinned on climate change, which misdirects public attention toward the narrow interest of climate change politics and away from broader questions about housing development, land management, and insurance industry business practices.
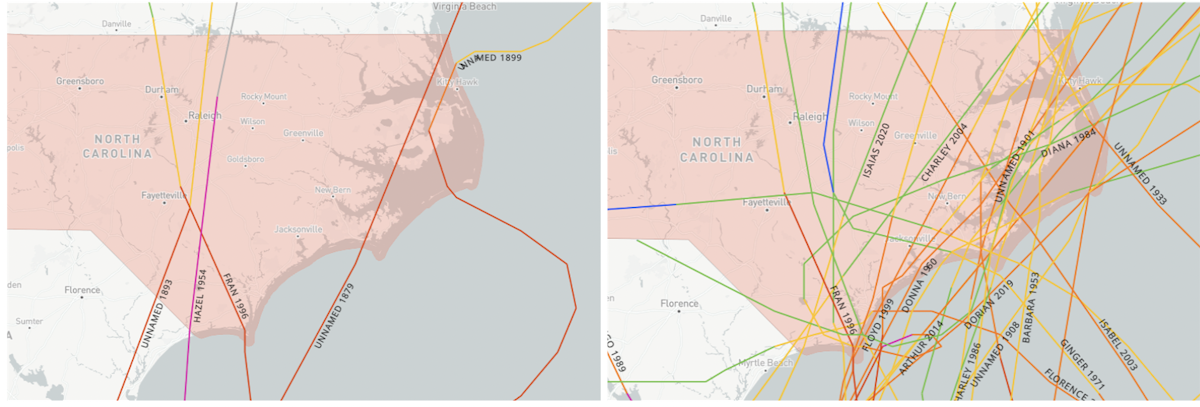
North Carolina’s Hurricane Landfalls
As we head into peak hurricane season, it is a good time to illustrate what exposure growth looks like. North Carolina as a great example. I’ve lived in coastal Wilmington for the past ten years. The region is hurricane prone, but there haven't been any major category landfalls in recent decades. In fact, the last Category 3 storm to make landfall there was nearly 30 years ago (Hurricane Fran in 1996). And the only Category 4 landfall in the state was 70 years ago (Hurricane Hazel in 1954). Prior to that, there were a couple of Category 3 landfalls in the late 1800s.
So, major category storms do happen in North Carolina, but not often. And between these events, the state has grown in population and wealth—that is, its exposure has boomed.
Even in the short time I’ve lived in Wilmington, that rapid growth in population and wealth has been notable. Just down the street from my home, a once undeveloped lot on the intracoastal waterway is now a luxury senior living facility. It is recent enough that Google Earth does not yet have an updated satellite photo.
This development marks a jump in exposure: On the left, there are trees. It would be sad to lose them in a storm, but they are not insured. On the right there are 130 residences filled with cars, restaurants, various other amenities, and a few boats down by the water. All of this property is insured.

Similarly, Wilmington developed the shores of the Cape Fear River in recent years. The Riverlights development has over 3,300 units with more potentially to come. The image on the left shows the area without any development in 2007. The image on the right shows the new communities and a new lake. There is a marina and some shops and restaurants.

Where there was once nothing but wetland and sand dunes, there is now a family-friendly AnyTown, USA community. The undeveloped land on the left below and the developed community immediately down the street on the right share the same likelihood of being hit by a hurricane, but you can bet that the hurricane will be “worse” where all the little blue houses are.

Southeast North Carolina
Mouchine Guettabi, a fellow professor at the University of North Carolina Wilmington, where I work, shared figures of changing population and wealth across the state. The biggest boosts in population are apparent in North Carolina’s southeast counties, which includes Wilmington in New Hanover County. But between 2020 and 2023, it was two other counties Brunswick County and Pender County that ranked first and second in the state for population growth.

Brunswick County is home to Leland. The images below show the development of Leland from an agricultural town of 1,860 people in 1990 (left) to a city of over 30,000 in 2024 (right). You can also see the development of the region south of Leland and the increasing density in the city of Wilmington on the West side of the river.

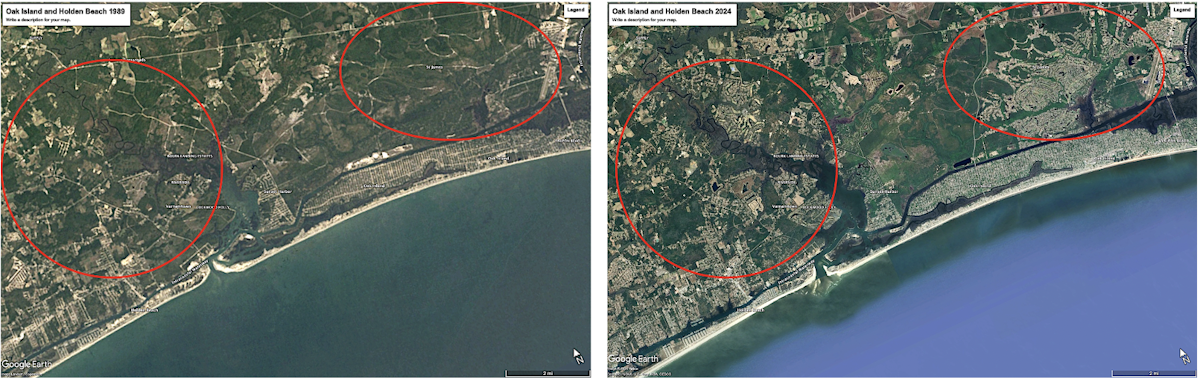
Brunswick County has seen a great deal of development along its Atlantic coast. The images below show this area in 1989 (left) and 2024 (right). The town of St. James arose from practically nothing toward the East (right side of frames), and agricultural land was transformed into neighborhoods behind Holden Beach toward the West.
The map below shows Brunswick County has experienced the greatest growth in wealthy people as measured by a difference between gross income of in-migrants minus that of out-migrants. But as a whole, the entire southeastern part of the state has substantially increased in wealth.

What all this means is that southeast North Carolina has experienced substantial growth in both population and wealth since its last experience with major category hurricane landfalls.
To be sure, Americans are wealthier today than in the past. Certainly, wealth is not distributed evenly. But, as a population we are richer than we were—at least represented by the amount of stuff we have and the built environment around us. Most everyone has more stuff. In turn, when hurricanes come ashore there is more valuable insured property in the way.
What is it like today in the United States:
- The most popular vehicle in 2024 is the Ford-150 with a price tag of about $37,000.
- 70% of households have one or two cars.
- The average number of televisions per household is 2.3, and 95% own one or more computers.
- The median size of a new single-family home is about 2,233 square feet.
Let’s take a look at what some historic North Carolina storms would cost if they occurred this season.
Category 4: Hurricane Hazel of 1954
When I first moved to Wilmington in January 2015, my family rented a little bungalow on Carolina Beach, a town on the southern end of Wilmington’s barrier islands. Black and white pictures of the devastation of the local community caused by Hurricane Hazel hung on the walls of the local diner. Although the storm made landfall on the border of Brunswick County south of Carolina Beach, it caused damage along most of the coast. According to original meteorological reports of Hazel:
The devastation along the North and South Carolina beaches was staggering. Every pier in a distance of 170 miles of coastline was demolished and whole lines of beach homes literally disappeared. In some places the tide was over 17 feet higher than mean low water

What was it like in 1954?
- The most popular car sold in 1954 was the Chevy Bel-Air at a price of about $1,800 ($20,637 in 2024 dollars).
- 64% of households had one car and nearly 30% did not have any
- 65% of households owned one television
- The median size of a new single-family home was about 1,500 square feet.
Hurricane Hazel caused $281 million in losses in 1954 across New Hanover, Pender, and Brunswick counties in North Carolina and Horry County in South Carolina.
The table below compares the social conditions of 1954 to that of 2024 represented by population across the four affected counties and wealth per capita. If a storm like Hurricane Hazel occurred this summer it may cause losses of about $53.15 billion.

Category 3: Hurricane Fran 1996
A bit over 40 years after Hazel, the southeastern region of North Carolina was hit by Hurricane Fran. I know a lot of people who remember Fran. According to reporting at NOAA, 75% of homes in Wilmington sustained some damage, with 24% sustaining major damage. Fran came ashore only slightly north of Hazel in Brunswick County

What was it like in 1996?
- The most popular vehicle sold that year was a Ford Taurus at a price of $19,000 ($37,953 in 2024$).
- About 90% of households had at least one car while 55% had two cars or more cars.
- 35% of households had three or more televisions and 65% had at least one; and 35% of households had a computer.
- The median size of a new single family home was about 2,000 square feet.
Hurricane Fran caused $3.2 billion in losses in 1996 across North Carolina’s Brunswick, New Hanover, Onslow, and Pender counties. The table below compares the social conditions of 1996 to that of 2024 represented by population across the four affected counties and wealth per capita.
If a storm like Hurricane Fran occurred this summer it may cause losses of about $17.04 billion.

Little Boxes
America’s problems with homeowners insurance go about as far back as our love affair with homeownership. In 1950, in response to rapid growth in homeownership the insurance industry created the homeowners policy, lumping together many risks into one bargain-basement price. Deep in the actuarial literature from the time are reports of industry members vocalizing concern that the policy underpriced risk—particularly from hurricanes—and catastrophic losses were destined to be a problem.
And so they were. Hurricane Betsy, later dubbed “Billion Dollar Betsy,” struck the Gulf Coast in 1965. It was the first storm to cause a billion dollars in losses. Three years later, as part of the Housing and Urban Development Act of 1968, intended to improve equity in housing and mortgage access, the government launched and fostered state development of several publicly run insurance programs to ensure disaster recovery and continued mortgage lending.
We’ve duct taped together a homeowners insurance system ever since.
Experience suggests that rising insurance premiums do not whip the public into making decisions in line with the moral judgements of nameless evaluators of all things good, nor are cities moved. Rather, increasing premiums results in decreasing coverage, a phenomenon known as the protection gap.
If the goal is affordable property insurance then a serious discourse needs to develop around policy options for mitigating risk, improving accountability for local land management decisions, the structure of the insurance regime, and dealing with normal disruptions from insurance business cycles and changing technologies. Climate change is a click-bait distraction from the hard work of economic and urban development policy.

