Methane matters, but doesn’t eliminate gains from emissions reductions
-
-
Share
-
Share via Twitter -
Share via Facebook -
Share via Email
-
In a recent article in the New Yorker, Bill McKibben argues that the emissions reductions achieved by the US over the last 15 years are largely illusory. Once leakage of methane (CH4) from natural gas is taken into account, he says, there is “no net effect on our total emissions of greenhouse gases.” This is based on an unsourced figure from Dr. Robert Howarth at Cornell University that purports to show that total US emissions from CO2 and CH4 have not declined meaningfully in recent years.
While Howarth’s analysis comports with McKibben’s argument, it is also problematic. It follows from a long history of Howarth arguing that natural gas is worse for the climate than coal, a position that has attracted extensive criticism from other researchers. In this case, it relies on applying a very short 20-year timeframe that maximizes the calculated impact of methane emissions.
By contrast, when standard 100-year global warming potential (GWP) values are used – as in official US GHG inventories – the effects of methane leakage are much smaller. According to this method, US CO2 emissions from energy have fallen around 13% since 2005, and this number only drops to 10–11% when the effects of methane leakage are included, depending on the leakage rate used.
The figure below shows the decline in US emissions using the standard GWP timeframe across a range of different natural gas leakage rates. They all differ substantially from Howarth’s chosen values.
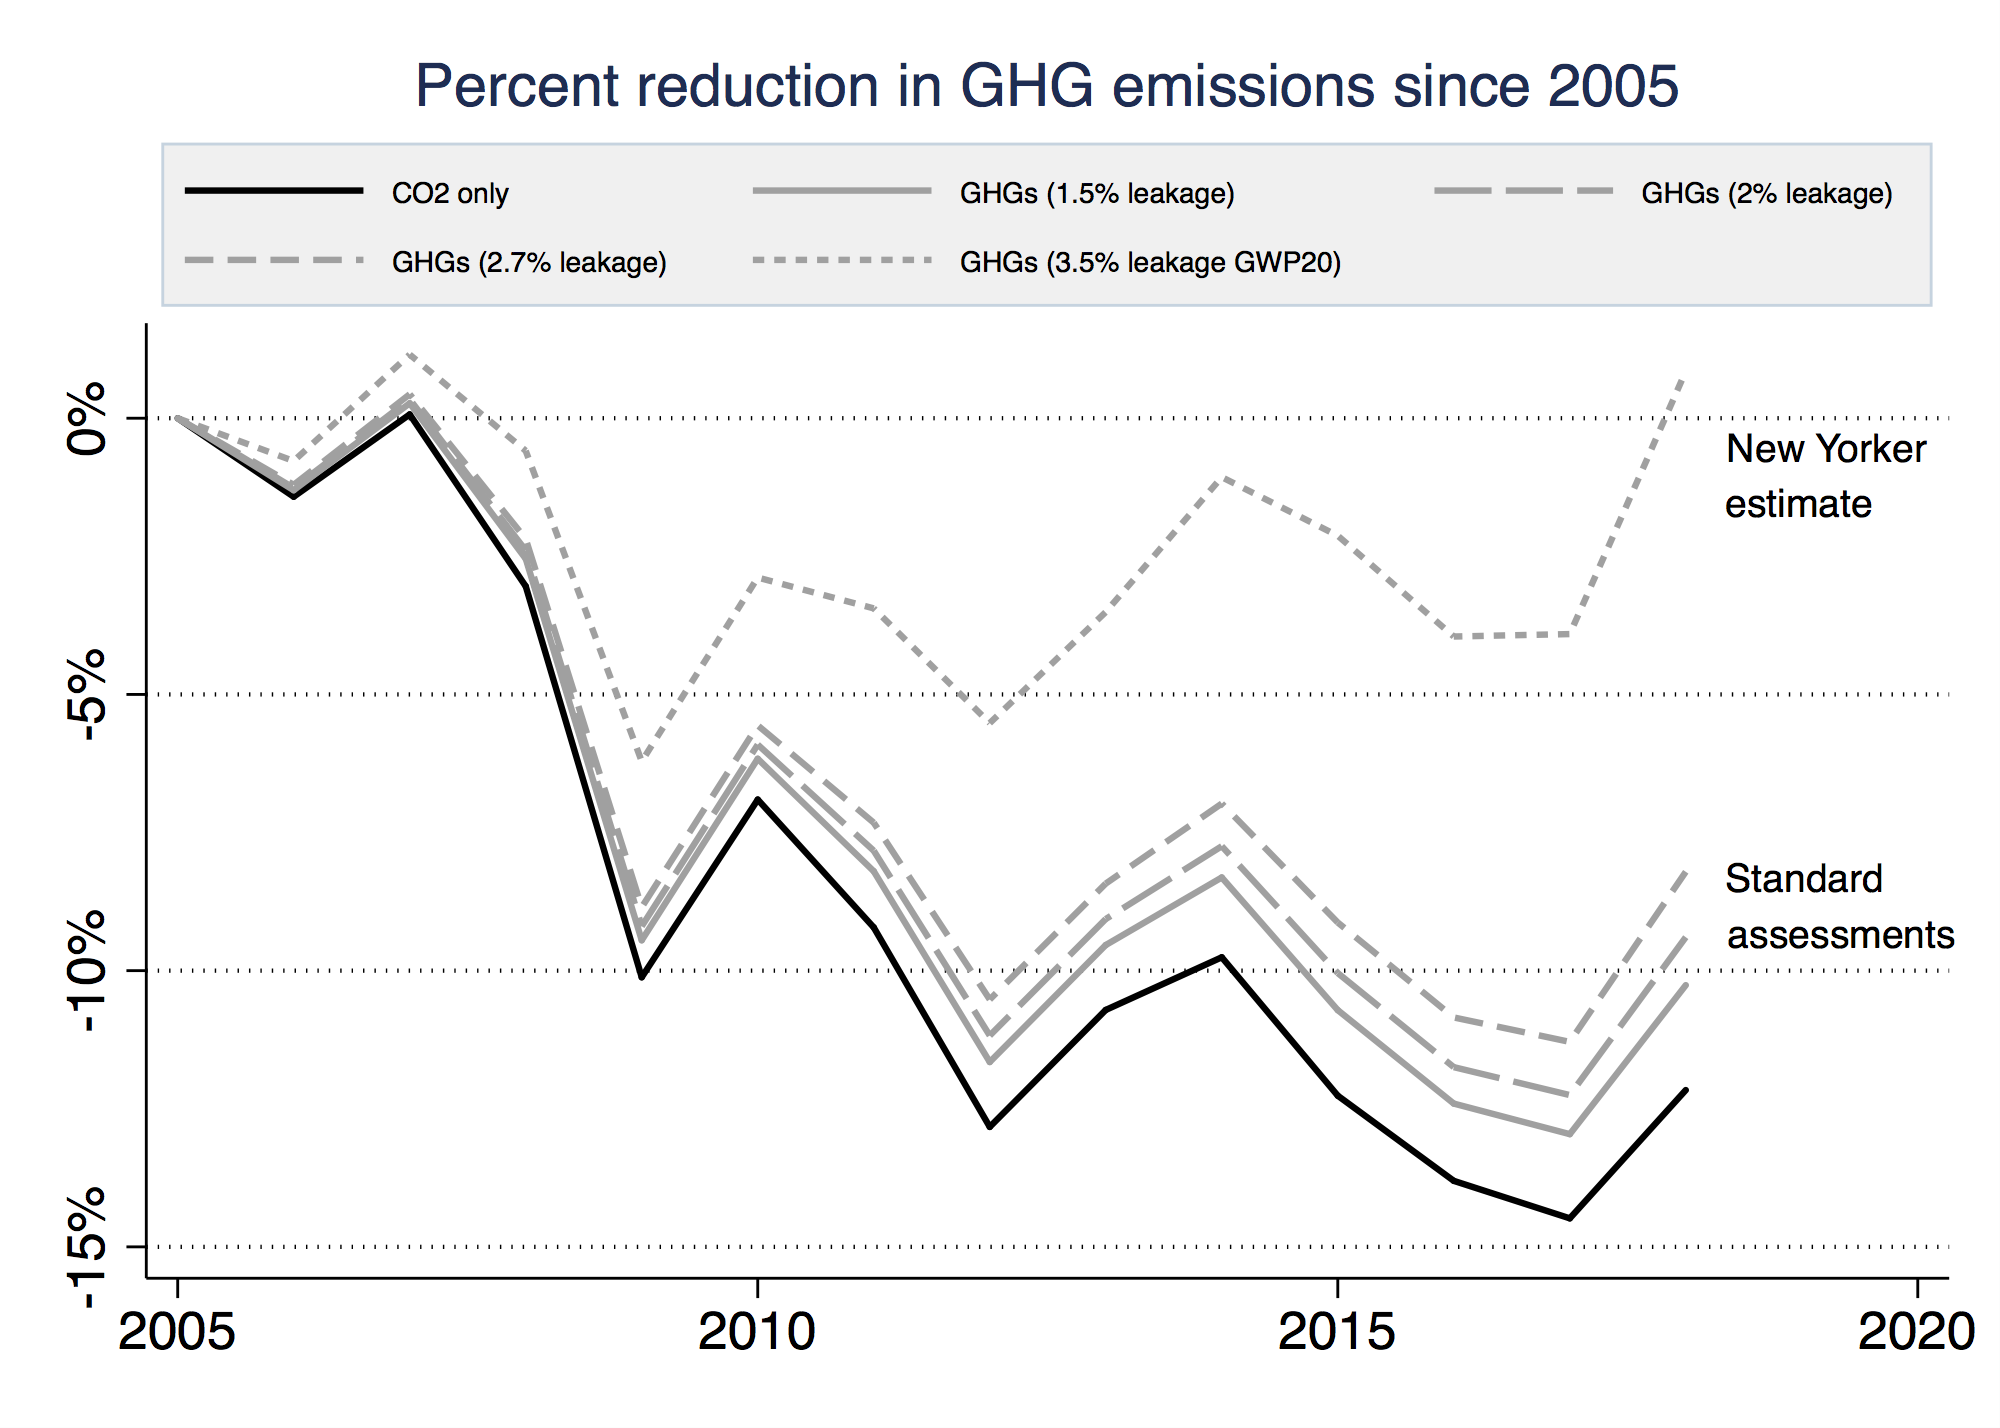
Methane leakage is important, and minimizing it can be a cost-effective way to reduce emissions. But it does not obviate the notable declines in US emissions over the past 15 years.
Natural gas is a driver of US CO2 emissions reductions
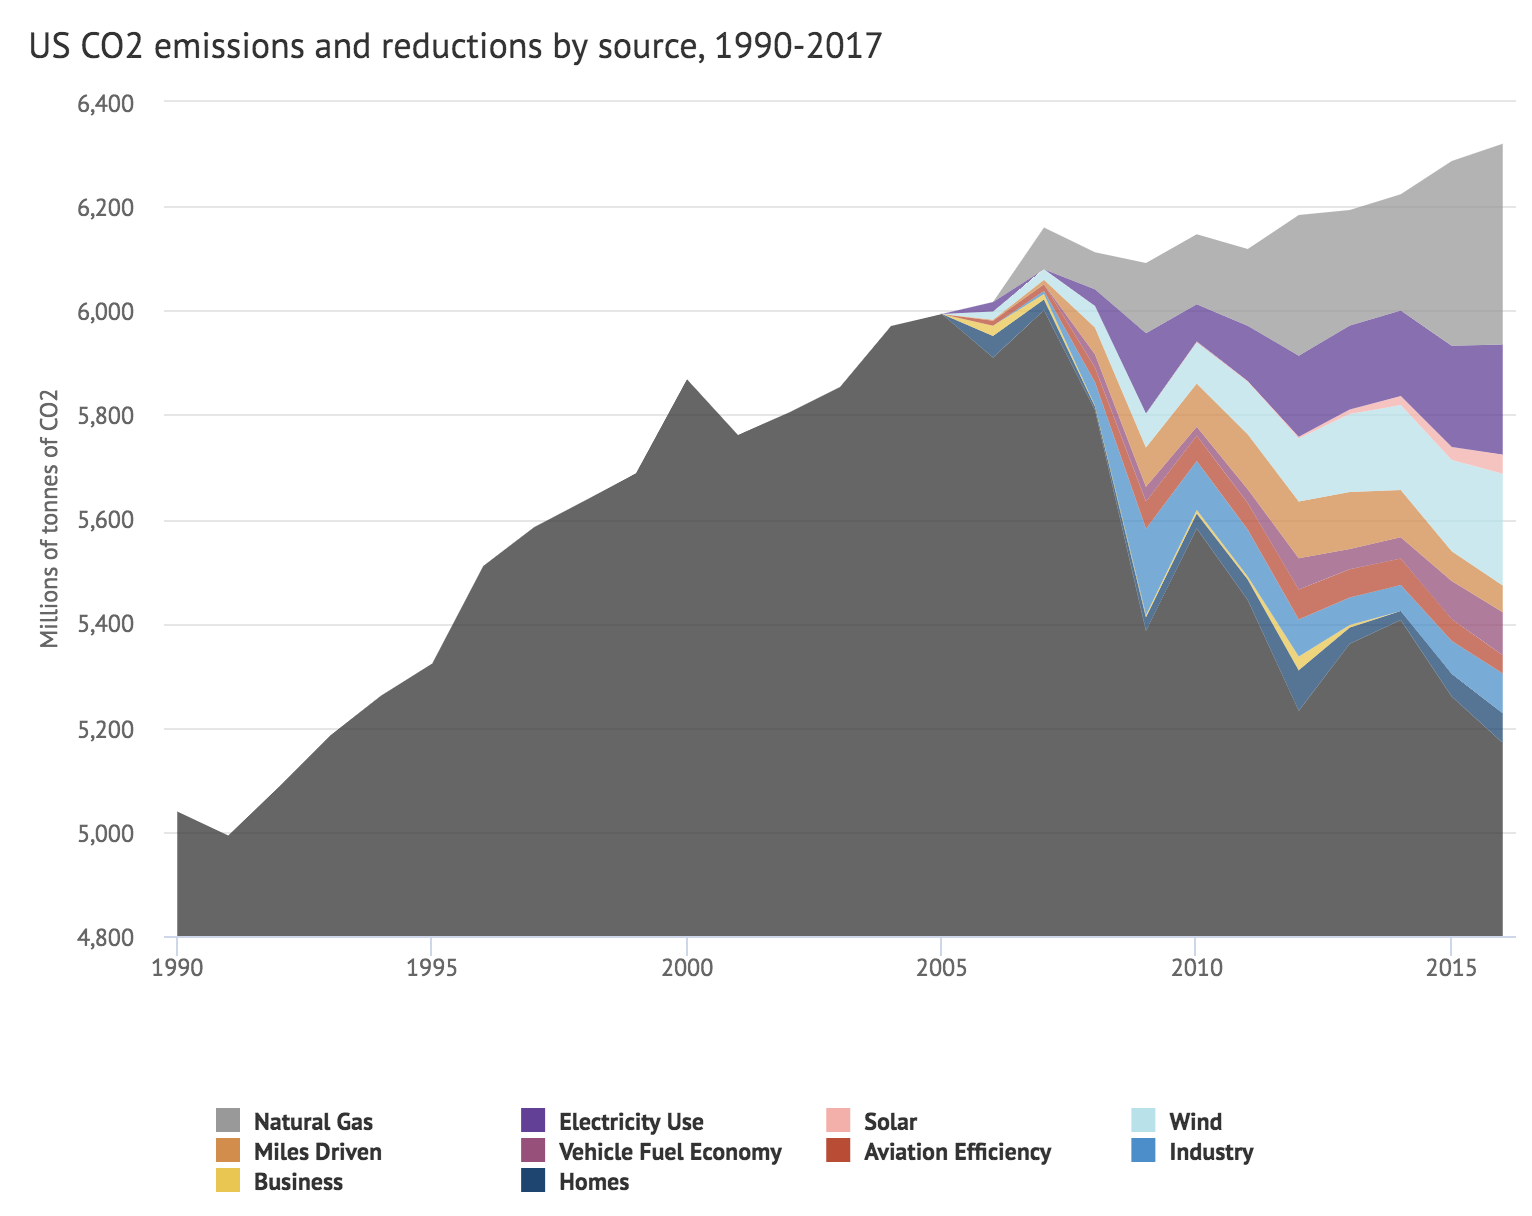
The decline in US CO2 emissions since 2005 is due to a wide variety of factors, including increases in wind and solar generation, reduced industrial and residential energy use, more efficient vehicles and air travel, and natural gas replacing coal. Because natural gas is responsible for only around half of the CO2 emissions per unit of electricity as coal, replacing coal with natural gas can reduce CO2 emissions, as indeed it has.
While it isn’t responsible for the majority of emissions reductions, natural gas replacing coal is the largest single driver.
Since 2005, the amount of US electricity from coal has been cut roughly in half, dropping from around 50% to 27%. While some of this coal was replaced by renewables, the bulk has been by natural gas, which nearly doubled (rising from 19% to 35%).
The figure below shows an estimate of the drivers of CO2 emissions reductions in the US; the black shaded region represents actual CO2 emissions; while each colored “wedge” represents emissions reductions attributable to different factors.
The short-term impact of methane emissions
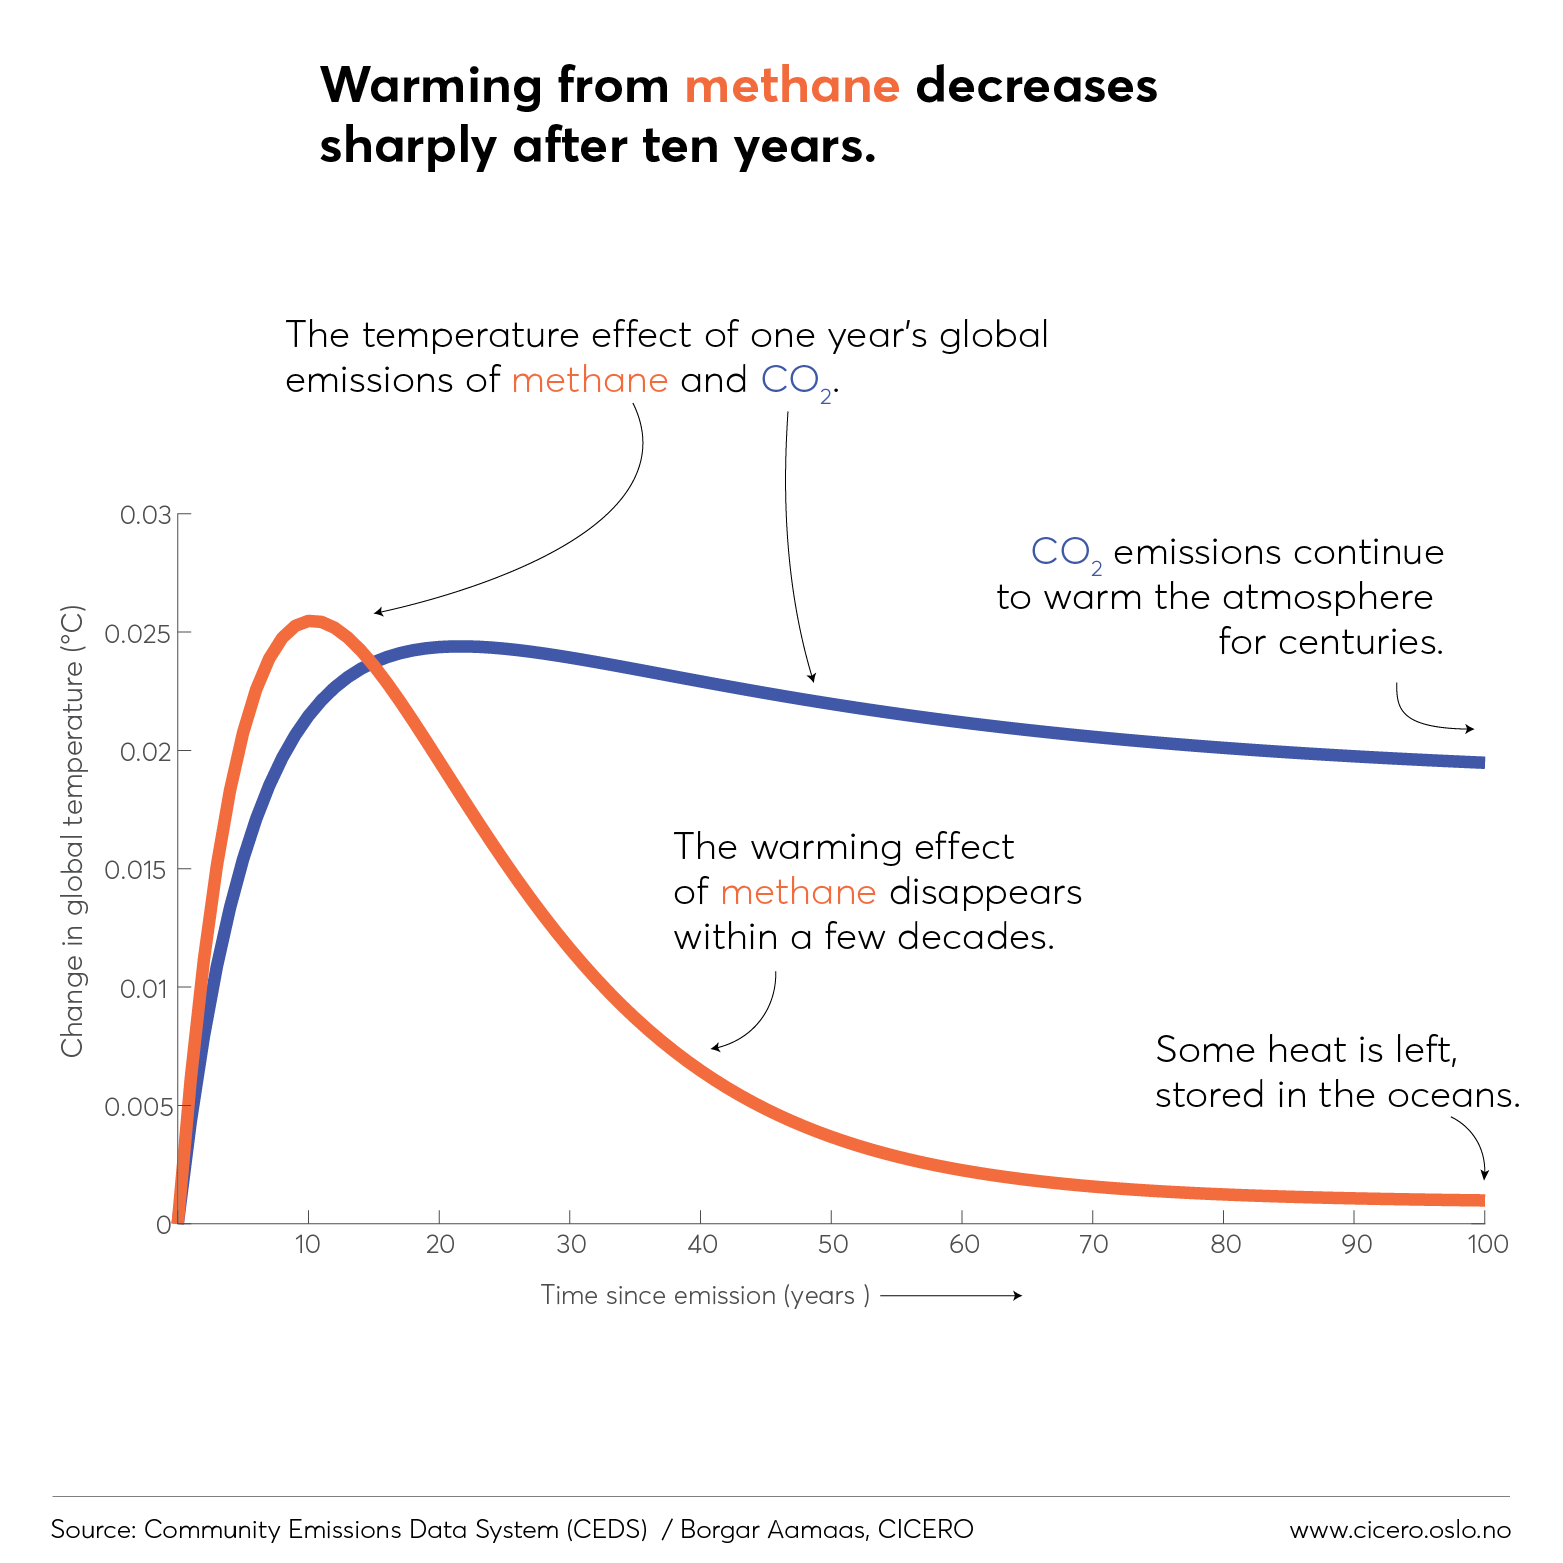
Natural gas is primarily methane (CH4), which is converted into CO2 when burned to produce electricity. But if any leaks during production, transport, or storage, it can have a much larger climate impact. Methane is a short-lived but very powerful greenhouse gas; while it is in the atmosphere it has a warming effect more than 100 times stronger than that of CO2.
However, methane has a very short atmospheric lifetime compared to CO2; almost all of the methane emitted today will be gone from the atmosphere within 10 years, while CO2 emitted today will affect atmospheric CO2 concentrations for centuries to come.
The figure below, from researchers at CICERO in Norway, shows the modeled effects of a single year of global emissions of both CO2 and methane on global temperatures. While CO2 emissions continue to warm the atmosphere through 2100 (and for centuries after), the warming effect of methane emissions peaks after around 10 years and quickly declines thereafter, reflecting the interplay of short atmospheric lifetime of methane and the role of the ocean in buffering the surface temperature response.
Just how much methane leaks from US natural gas systems have long been a source of controversy. While official EPA inventory estimates suggest a system-wide leakage rate of around 1.5%, dozens of studies have found much higher leakage rates at individual fields. Two recent studies, both in the journal Science, have reviewed a wide range of site- and region-specific estimates to try and obtain the most accurate figure for US-wide methane leakage. Adam Brandt and colleagues, writing in 2014, suggested that actual leakage from natural gas systems was between 1.25 and 1.75 times larger than official inventories, implying a leakage rate of between 1.9% and 2.6%. A more recent review by Ramón Alvarez and colleagues in 2018 found a similar leakage range of 2% to 2.7%.
Why a short timeframe is problematic
Given their vastly different atmospheric lifetimes and warming effects, comparing CO2 and methane emissions can be quite difficult. The most common approach is to add them together using their global warming potential (GWP) values, which account for the average heat-trapping effect over a particular time period. The standard time period used in GHG inventories for this comparison is 100 years, a period over which methane has a GWP around 34 times larger than CO2.
Not everyone takes this approach, however. Some — including Howarth, whose figure McKibben relies on minimizing US emissions reductions — have argued that a shorter 20 year period should be used instead. Over 20 years methane has a GWP 86 times larger than CO2, as more remains in the atmosphere over the shorter time period.
The choice of GWP period comes down to the perceived importance of near-term vs. longer-term warming. And while there is a case to be made for the shorter timeframe, it is a weak one.
The problem with a 20-year GWP is that it can perversely incentivize reducing methane over CO2, even though nearly all of the methane emitted today will be gone from the atmosphere within the next 10 years. A recent paper in Nature Climate Change argued that shorter GWP values overemphasize the role of short-term pollutants like methane at the expense of CO2, with author Ray Pierrehumbert telling the Washington Post that “People are placing too much emphasis on methane…. People should prove that we can actually get the CO2 emissions down first, before worrying about whether we are doing enough to get methane emissions down.”
Of course, there is much about the Earth’s climate that is still unknown, and scientists can’t categorically rule out the potential for shorter-term warming to cause unforeseen impacts. That said, climate models, by and large, don’t predict any irreversible changes in periods as short as 30 years, and potential tipping points in the climate generally depend more on the peak warming that occurs (which in nearly all foreseeable cases would occur after 2050), rather than rate of warming today.
With longer-term warming, the impacts are much more clear (and generally more dire). By the end of the century, we can expect well over 3C warming in a world where we didn’t take any action to slow emissions. As the damages of climate change tend to increase exponentially with rising temperatures, many economists argue that the biggest impacts of climate change will occur later in the century, and that the main focus should be on reducing longer-term warming.
How the choice of timeframe and leakage rate change the outcome
Using the EPA’s estimated leakage rate of around 1.5% and a 100-year GWP, we estimate the combined CO2 and methane emissions of each fuel (in million metric tons of CO2-equivalent). This corresponds with official inventory estimates, and shows a marked reduction in energy-related greenhouse gas emissions of about 12% compared to their 2005 peak. This differs substantially from the figure shown in the New Yorker article, which suggests much more modest declines.
However, the actual rate of methane leakage is likely higher than the EPA figure. To correct for this, we can use the range in the recent Alvarez et al. review (e.g. 2% to 2.7%) to see how the numbers change. And we can compare the outcome with Howarth’s figure that McKibben used in the New Yorker, which assumed a 3.5% leakage rate and used a GWP period of 20 years rather than the standard 100.
The figure below shows the total greenhouse gas emissions (CO2 and methane) for coal in brown, and natural gas in blue. The different leakage rates and GWP assumptions are shown by various dashed lines.
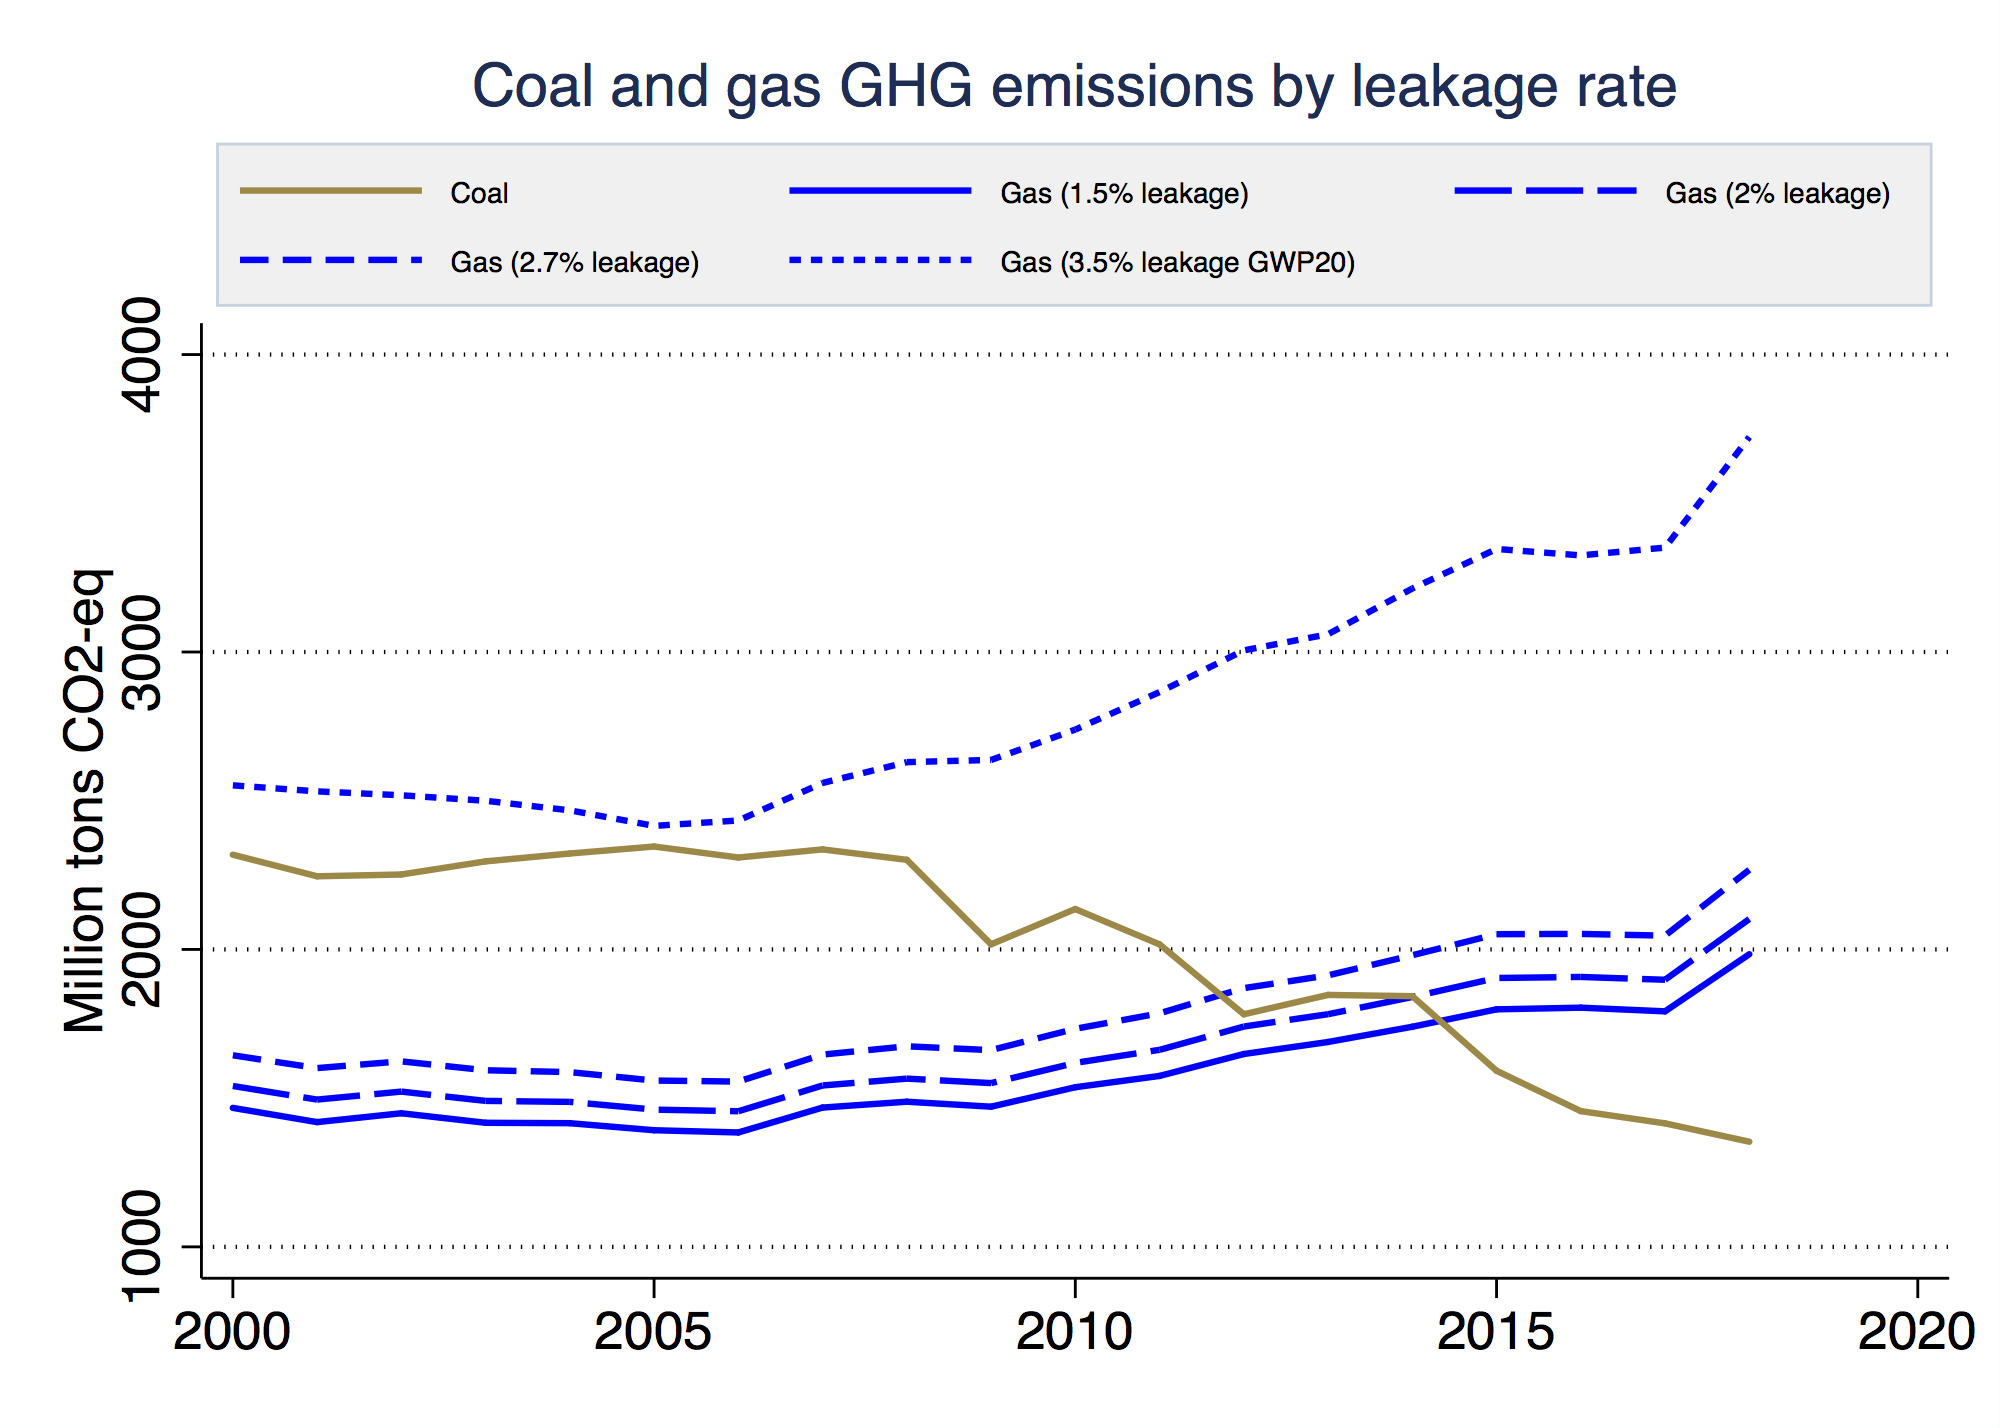
While the higher leakage rates in the Alvarez et al. study modestly increase the total GHG emissions from natural gas, they don’t fundamentally change the picture. It is only when higher leakage rates and – more importantly – short GWP timeframes are used that total greenhouse gas emissions from natural gas appear dramatically larger than those from coal (blue dotted line).
When only CO2 is considered, energy-related emissions have fallen by 13% since 2005. If we include leakage from methane, but use the EPA estimated leakage rate of 1.5%, we get a 12% reduction in emissions. Using the more realistic leakage estimates in the Alvarez et al. result in reductions of 11% and 10%, respectively. It is only when using Howarth’s assumed 3.5% leakage rate and a 20-year (rather than 100-year) GWP that we see minimal reductions of only 2% since 2005. While the choice of GWP timeframe is open to debate, presenting this choice as uncontroversial — as McKibben implicitly does — is highly misleading.
Resolving the debate
Clearly, GWP is not an ideal metric to assess climate impacts of different types of emissions, since the results are heavily dependent on the timeframe used. So is there no way to resolve the question of how best to calculate climate impacts? Is the choice of timeframe an irreducible question of values?
Fortunately, simple climate models can be used to look at the actual effects of CO2 and methane over time, allowing for more accurate comparisons.
The figure below, taken from my 2015 Energy Policy paper, shows the climate impacts over time (measured in units called radiative forcing) of existing coal (the dashed black line), new high-efficient coal plants (the solid black line), and new gas plants (the green line), assuming the same amount of power is generated from each over a 30-year period. The potential range of natural gas leakage is expressed by the gray envelope around the green line, with 1% leakage at the bottom and 6% leakage at the top (the green line itself shows a 2% leakage case).
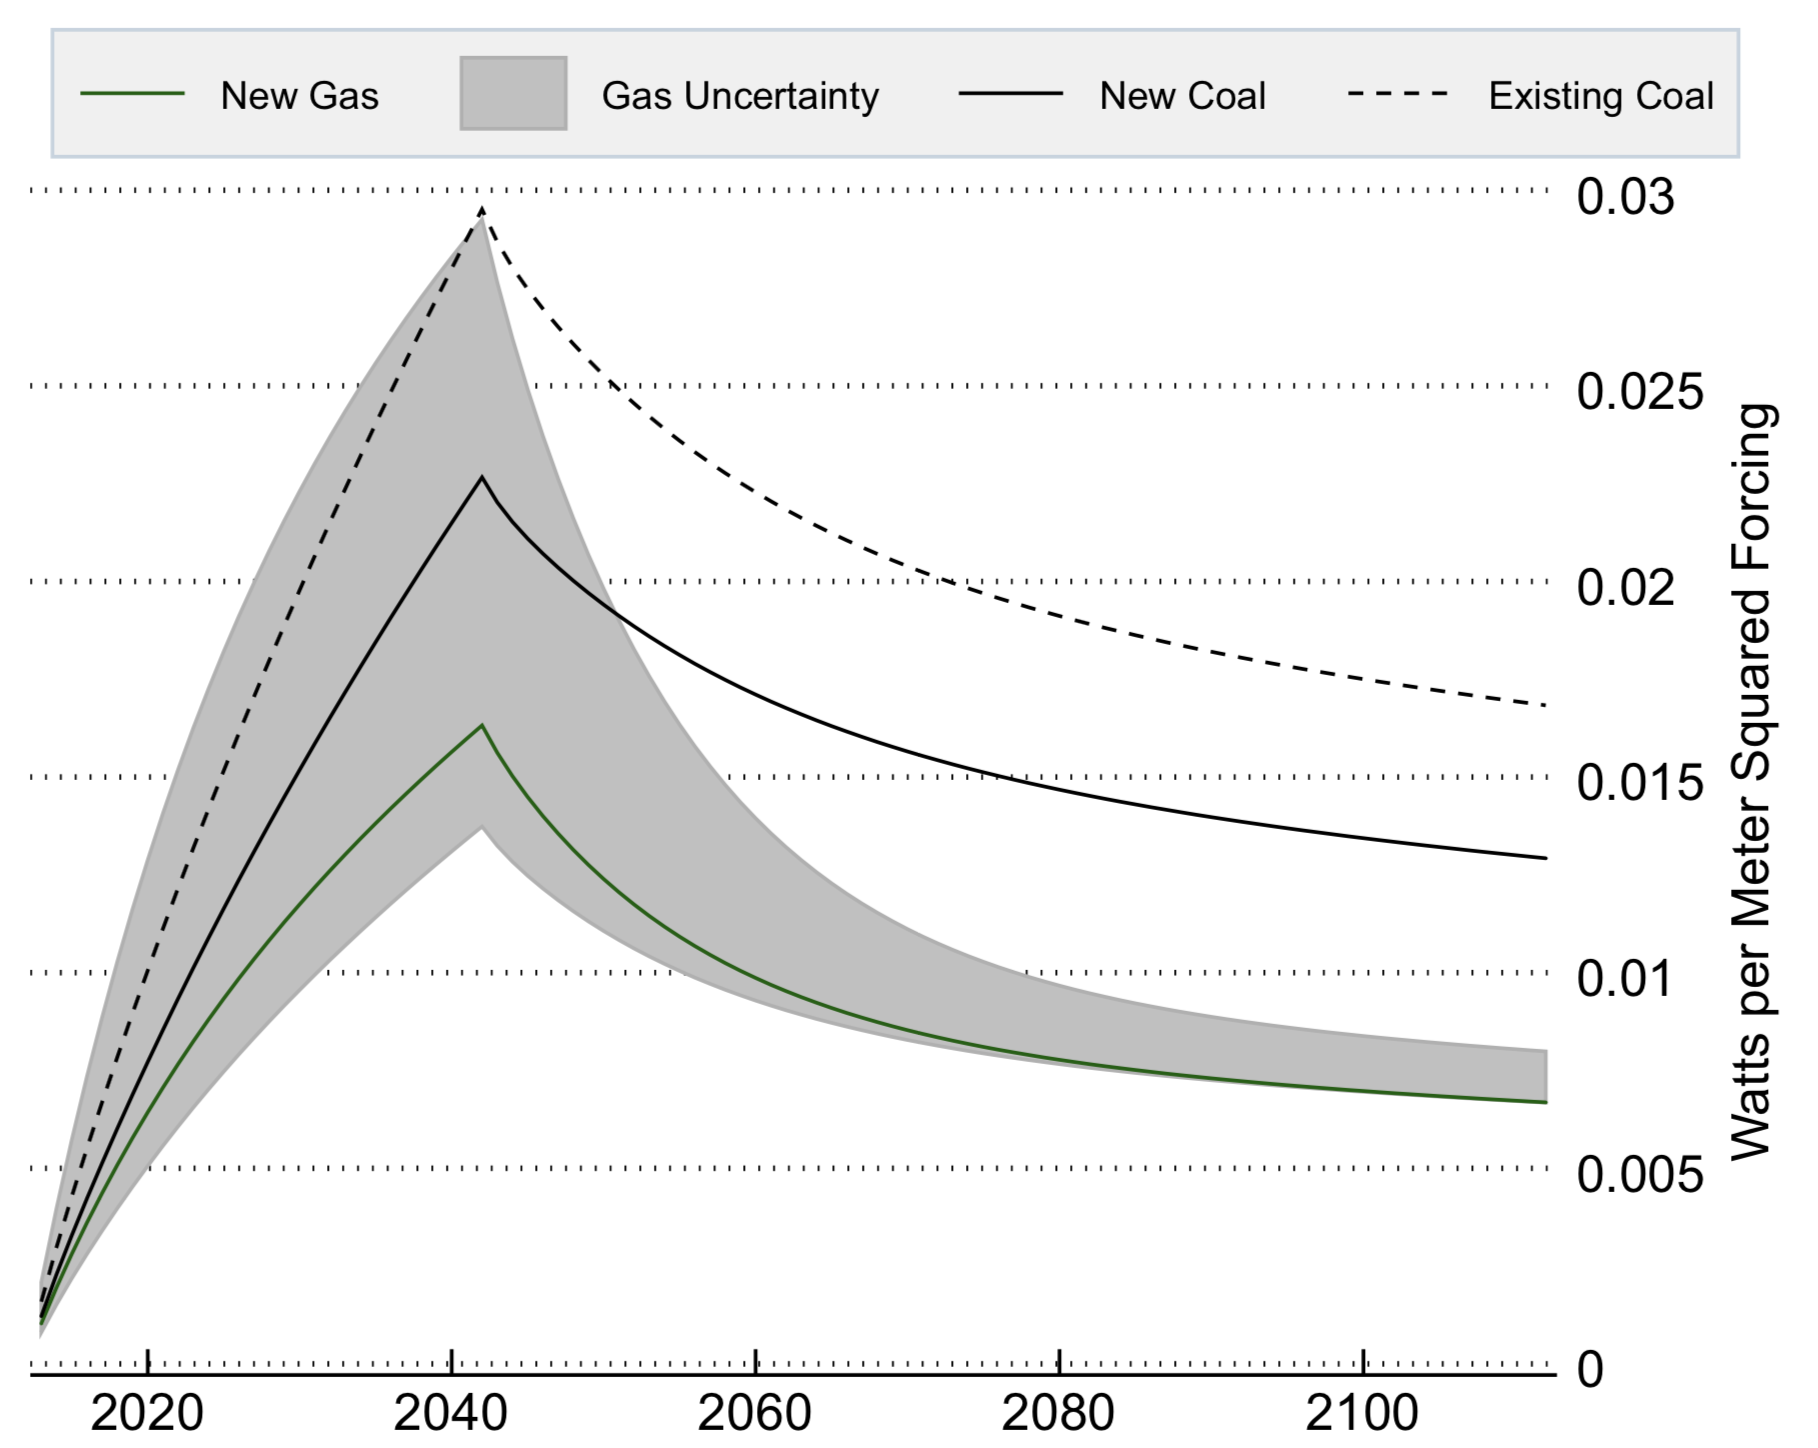
If leakage is higher than 3%, there are some periods in the next 30 years when gas will result in more climate impact than new coal plants. And if its higher than 4%, gas will sometimes be worse than existing coal plants. But no matter what the leakage rate is, gas will still cut the climate impact by up to 50% in 2100 compared to new coal and 66% compared to existing coal.
Deep decarbonization will ultimately involve either replacing natural gas plants with zero-carbon alternatives or equipping them with carbon capture and storage technology. While natural gas has provided a bridge away from coal in the US, it is a bridge that is quickly reaching its end, as the number of remaining coal plants rapidly shrinks and the falling cost of renewables makes them an increasingly large driver of power sector decarbonization.
Calculations
Total greenhouse gas emissions from energy are calculated by combining CO2 and CH4 emissions, following the approach used by Howarth in the figure in the New Yorker article. This approach excludes energy-related N2O emissions, though these are relatively small as the vast majority of N2O emissions come from agriculture.
Specifically:
CO2 emissions from energy by fuel were taken from EIA’s Monthly Energy Review.
CH4 emissions from coal were based on 2017 coal mine CH4 emissions from the EPA. These were estimated for other years by scaling the 2017 value by the CO2 emissions from coal relative to 2017.
CH4 emissions from natural gas were estimated based on the following leakage rates:
EPA Inventory: 1.5%
Brandt et al 2014: 1.88% to 2.63%
Alvarez et al 2018: 2% to 2.7%
Howarth: 3.5%
Total leakage is estimated by multiplying the leakage rate by the total natural gas production (excluding non-methane natural gas liquids) data from the EIA’s Monthly Energy Review.
Reductions in US GHG emissions relative to their 2005 peak presented in the text (e.g. “between 10% and 11%”) are calculated by looking at the difference between emissions over the past three years (2016-2018) and 2005. This approach, taken as emissions in any single year, can be subject to strong weather-related variability – which was one of the major drivers of the uptick in US emissions in 2018.