A 3C World Is Now “Business as Usual”
-
-
Share
-
Share via Twitter -
Share via Facebook -
Share via Email
-
The world is on a path to warm around 3C above pre-industrial levels by 2100 under policies and commitments currently in place. This is a far cry from the 1.5C and 2C targets enshrined in the Paris agreements, but is also well short of the 4C to 5C warming in many “business as usual” baseline scenarios that continue to be widely used.
Two recently released reports — the International Energy Agency (IEA) 2019 World Energy Outlook (WEO) and the UN Environment Program (UNEP) 2019 Emissions Gap Report — both reflect current trends in clean energy technology costs and deployment and make the case that global emissions will be relatively flat over the next few decades. These estimates are on the low end of those in the latest set of fully integrated baseline scenarios featured in the energy modeling literature that intend to depict a world without climate policy — the Shared Socioeconomic Pathways (SSPs), developed for the upcoming 2021 IPCC 6th Assessment Report (AR6).
But what about by the end of the century? In this analysis, we take the 2040 IEA emissions projections and examine their implications for end-of-century warming. We find that IEA numbers imply that the most likely outcome of current policies is between 2.9-3.4C warming — which is reduced to around 2.7-3C warming if countries meet their current Paris Agreement commitments.
Uncertainties surround this projection, of course. For one, there are uncertainties in the sensitivity of the climate to rising atmospheric greenhouse gas concentrations that mean emissions expected to produce warming of around 3C could result in warming as little as 1.9C or as much as 4.4C.
And future emissions trajectories are themselves highly uncertain. A business-as-usual outcome is just that — a scenario that seems most likely given current trends. We may see a future in which rising nationalism and isolationism leads to high global inequality, population growth, and a resurgence in the use of domestic coal. Or we may see one in which technological advances and falling prices in clean energy lead to declining emissions, even in the absence of new climate policies.
Our business-as-usual projection of 3C of warming — rather than 4 or 5C — is a testament to the progress in global decarbonization over the last few decades. It also reflects the fact that rapid growth in coal use during the 2000s was not necessarily characteristic of longer-term energy use trends. The world has taken concrete steps to move away from coal in the past decade, and this progress should be reflected in our assessment of likely emissions pathways — and their resulting climate impacts — going forward.
The worst case outcomes of ten years ago appear far less likely today. But there is also a risk of overenthusiasm about progress; there is still an ever-growing gap between current emissions and what would be needed to limit warming below 2C. With every year of continued emissions growth and increased deployment of clean energy, we make both low warming (<2C) and high warming (>4C) increasingly unlikely.
Relatively flat global emissions through 2040
The recently released IEA WEO forecasts likely CO2 emissions from fossil fuels through the year 2040. They examine three scenarios: a current policies scenario (CPS) where no new climate or energy policies are enacted by countries, a stated policies scenario (STPS) where Paris Agreement commitments are met, and a sustainable development scenario (SDS) where rapid mitigation limits late 21st century warming to well-below 2C. The WEO provides estimates of CO2 emissions from fossil fuels, but does not include emissions of other greenhouse gases or CO2 emissions from land use change.
Both the IEA CPS and STPS scenarios can be considered as business-as-usual worlds where either current policies or current commitments continue, but no additional climate policies are adopted after that point. They show notably lower emissions through 2040 than most of the no-climate-policy baseline scenarios in both the IPCC 5th Assessment report (AR5) and the new SSP database.

IEA CPS emissions in 2040 are in-between the SSP4-6.0 and SSP2-4.5 scenarios, and are in the bottom 15% of all the baseline scenarios in the SSP database. The SPS scenario is a bit below SSP2-4.5, and lower than any baseline scenarios — though this is not necessarily unexpected, as baseline scenarios exclude current commitments that have not yet been translated into policy.
The term ‘no policy’ scenario has a specific meaning for the energy modeling community, but much of this meaning gets lost in translation to the users of the scenario results. No policy baselines refer to a world where no additional climate policies are adopted by countries beyond those already in place beyond their base year — which for the SSPs was 2010. In practice, this means that these models have no explicit carbon price beyond those already in place, though efficiency and technology improvements continue to occur in many of these scenarios and are implicitly driven at least in part by future policies, albeit ones that do not target greenhouse gas emissions directly.
IEA scenarios still project future growth in fossil fuel use through 2040, just slower than most IPCC baseline scenarios, particularly for coal. For example, IEA’s CPS predicts that coal consumption will grow by around 0.5% per year through 2040, compared to growth rates between 1% and 3% for most AR5 and SSP baseline scenarios. Average annual growth in coal combustion across AR5 and SSP baseline scenarios is 1.5%.
The recent UNEP Emissions Gap report provided an estimate of combined emissions from all greenhouse gases — including land use change — in the year 2030 under both current policy and under a scenario where countries meet their Paris Agreement nationally determined contributions (NDCs). UNEP’s current policies scenario has 2030 GHG emissions of 60 GtCO2e. This falls between SSP2-4.5 (57 GtCO2e) and SSP3-6.0 (62 GtCO2e), and is well below SSP3-7.0 (69 GtCO2e) and the worst-case SSP5-8.5 (71GtCO2e). UNEP projects 2030 emissions of 54 GtCO2e if all Paris Agreement NDCs are met.
Estimating 21st century emissions
IEA projections only run through 2040, so using them to constrain end-of-century temperatures involves large uncertainties regarding what will happen after that point. The IEA’s CPS is between the IPCC SSP4-6.0 and SSP2-4.5 scenarios in 2040, while the IEA’s STPS is a bit below SSP2-4.5. However, both SSP4-6.0 and SSP2-4.5 show declining emissions between 2040 and 2100, driven in part by carbon prices assumed in the models underlying those scenarios – something that is not necessarily guaranteed to happen in the future.
The figure below compares the IEA fossil fuel emissions projections to a number of different emissions scenarios being used in the upcoming IPCC 6th Assessment Report (AR6). Each colored line represents a different emissions scenario used as inputs into CMIP6 climate models, while the grey shaded area shows the range of no-policy baseline scenarios in the SSP database.
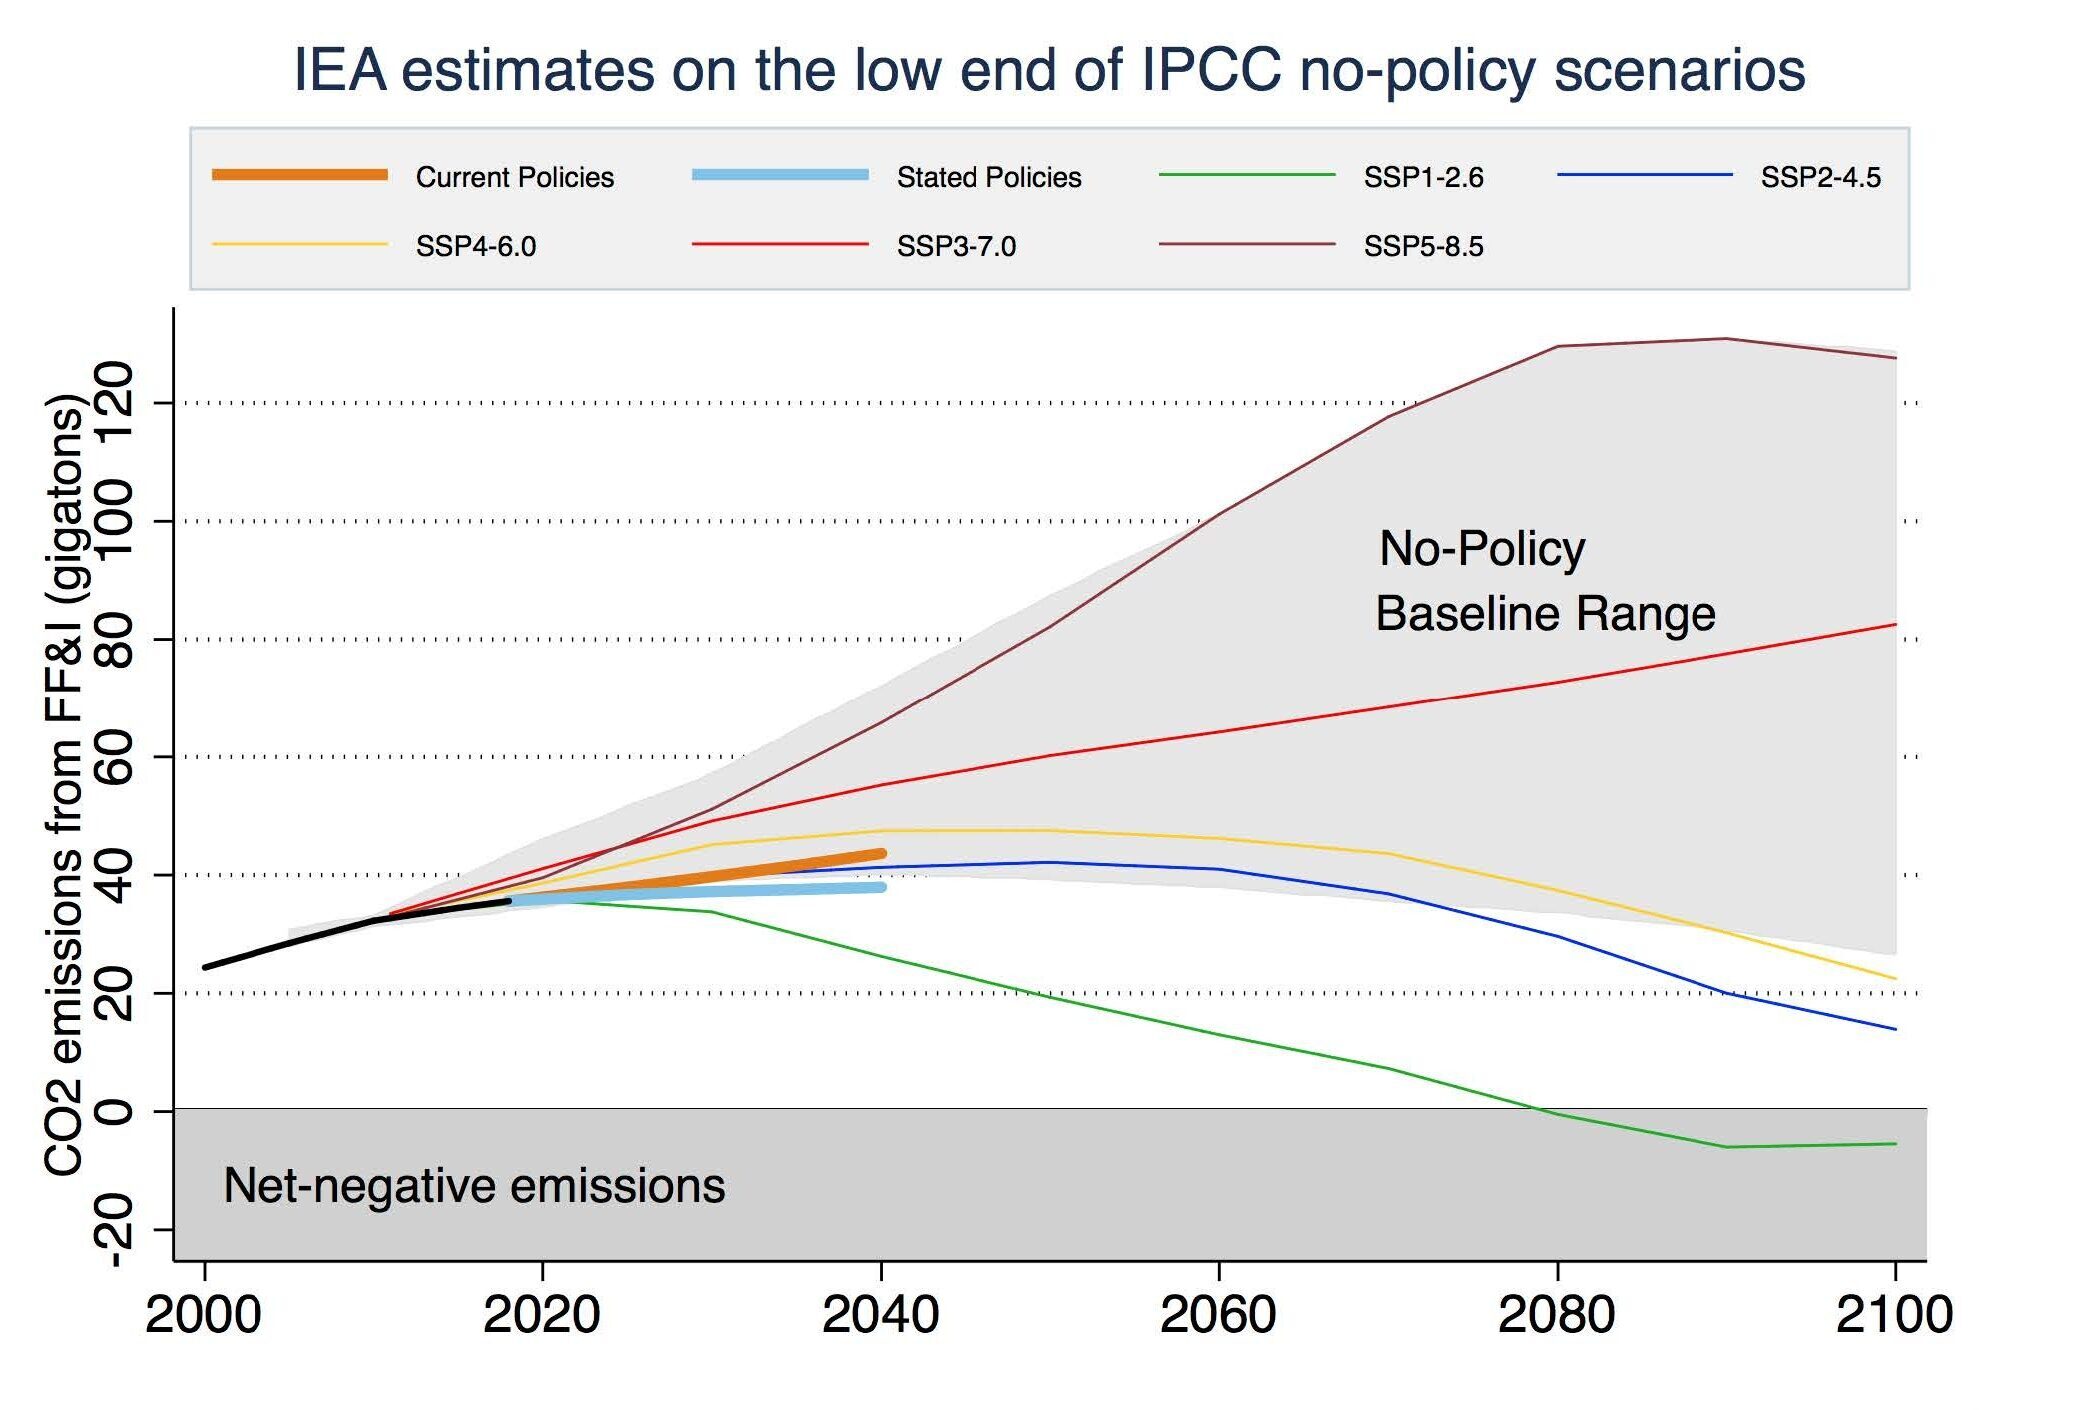
IEA’s CPS is on the low end of the baseline range between present and 2040, while STPS is below any baseline scenarios — though given that it includes additional Paris Agreement commitments this is not necessarily surprising.
The AR6 emissions scenarios include two new baseline scenarios — a new SSP3-7.0 scenario that lies close to the middle of the no-policy baseline range and well below the RCP8.5-successor SSP5-8.5 scenario. However, even SSP3-7.0 has much higher 2040 emissions from fossil fuels and industry — 55 GtCO2 — than the 44 GtCO2 and 38 GtCO2 in the two IEA scenarios.
We explore two different ways to extend the IEA 2040 emissions projections through the end of the century. First, we simply assume that emissions remain flat at 2040 values after that point. While its possible for technological innovation and falling clean energy prices to drive down global emissions even in the absence of climate policy, this is by no means guaranteed to be the case, so flat emissions going forward represents a reasonably realistic means of modeling a no-policy outcome.
In addition, we consider a case where emissions keep increasing in both CPS and STPS through the rest of the century at the same rate they were increasing between 2030 and 2040. This makes relatively little difference for STPS, as emissions had already flattened, but leads to notably higher emissions in the CPS case. This can be considered a more pessimistic business-as-usual scenario, where the absence of climate policy and slow rates of technological innovation result in relatively little additional progress in reducing the rate of emissions growth after 2040.
The figure below shows both the CPS and STPS fossil fuel and industry emissions through 2040, with the shaded area after 2040 showing the range between the constant emissions and the linearly increasing emissions scenario extensions.

Even a current policies scenario where emissions continued to steadily grow rather than leveling off after 2040 would still end up well-below the commonly used RCP8.5 (SSP5-8.5) scenario, which represents the highest end of the range of no-policy baseline scenarios examined in the literature. It would also have CO2 emissions around 20% lower than SSP3-7.0. Even if emissions do not peak after 2040, the lower emissions values in 2040 means that the total emissions over the century remain substantially lower.
Calculating end-of-century warming
The amount of warming the world is projected to experience can be pretty closely approximated solely based on cumulative CO2 emissions. This relationship between temperatures and cumulative emissions is referred to as the transient climate response to cumulative carbon emissions, or TCRE. Using the TCRE values developed in the IPCC Special Report on 1.5C (SR15), we can calculate the amount of warming expected over the remainder of the century in our extended IEA scenarios, as well as the uncertainty introduced by the wide range of possible climate sensitivity values.
In the figure below we show the amount of warming between the last decade of the 20th century and the temperature of the late 1800s (which is somewhat representative of preindustrial temperatures) for the four RCP scenarios used in the IPCC AR5 and the extended IEA STPS and CPS cases — assuming flat emissions in each after 2040. The width of each bar reflects the 90th percentile range of warming given the uncertainty in climate sensitivity, while the central point represents the average of all the climate models running that scenario.
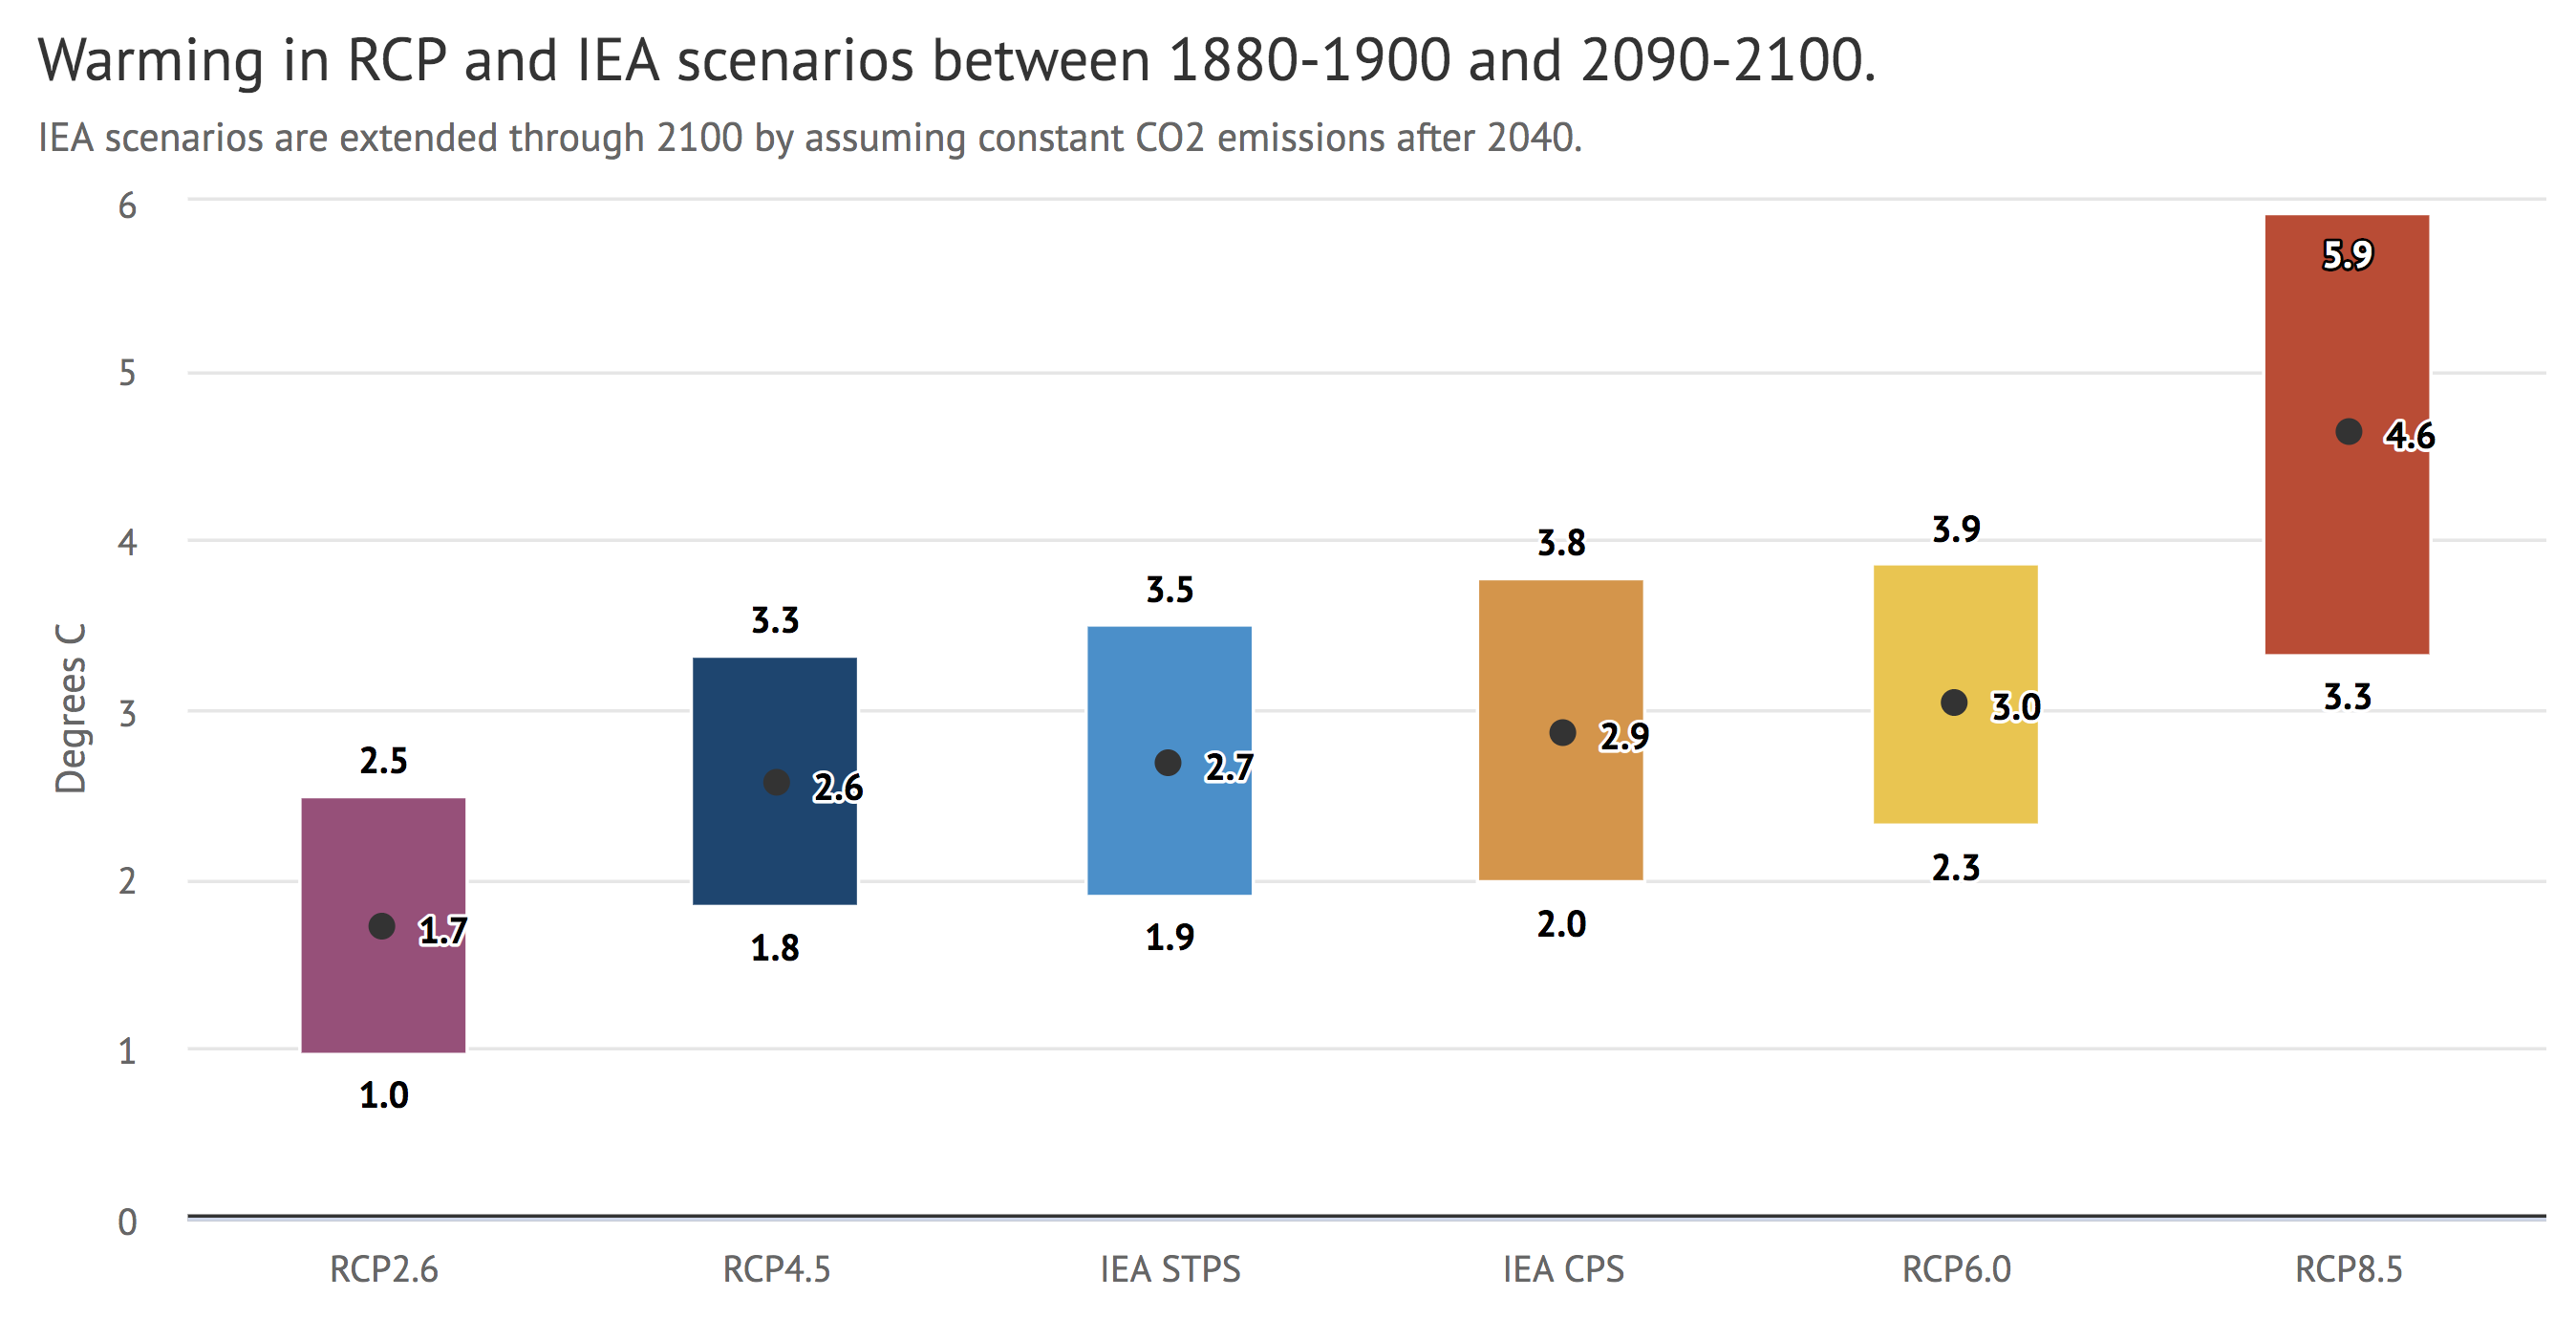
Warming in the the two IEA scenarios is calculated based on the difference between cumulative fossil fuel and industry emissions in each scenario and that in the SSP2-4.5 scenario. These cumulative emissions differences are converted into additional warming based on the IPCC SR15 TCRE value of 1.65C per 1000 PgC, with a range from 0.8C to 2.5C / 1000 PgC reflecting uncertainties in climate sensitivity. Finally, this additional warming is added to RCP4.5 warming projections, with the average, low, and high TCRE-based additional warming values added to the average, low, and high RCP4.5 warming values, respectively.
In this analysis the two IEA scenarios imply end-of-century warming of a bit below 3C (2.9C for current policies, 2.7C for stated policies). They are a bit higher than the 2.6C mean outcome in RCP4.5, and lower than the 3C mean of RCP6.0. They produce nowhere near as much warming as the 4.5C mean estimate of RCP8.5, the scenario often described as a “business as usual” scenario. However, the uncertainties in climate sensitivity mean that current policies may result in as much as 3.8C warming — or as little as 2C warming.
There are a number of choices made in this analysis that may change the results. For example, instead of holding emissions flat after 2040 — as in the figure above — we could have them continue to increase at the rate experienced over the prior decade. The choice of which scenario to use for non-FF&I climate forcings like methane and aerosols also matters, as well as whether the IEA scenario warming is calculated relative to cumulate FF&I emissions in RCP4.5 or RCP6.0. To explore how sensitive our results are to these choices, we examine them all in the figure below.
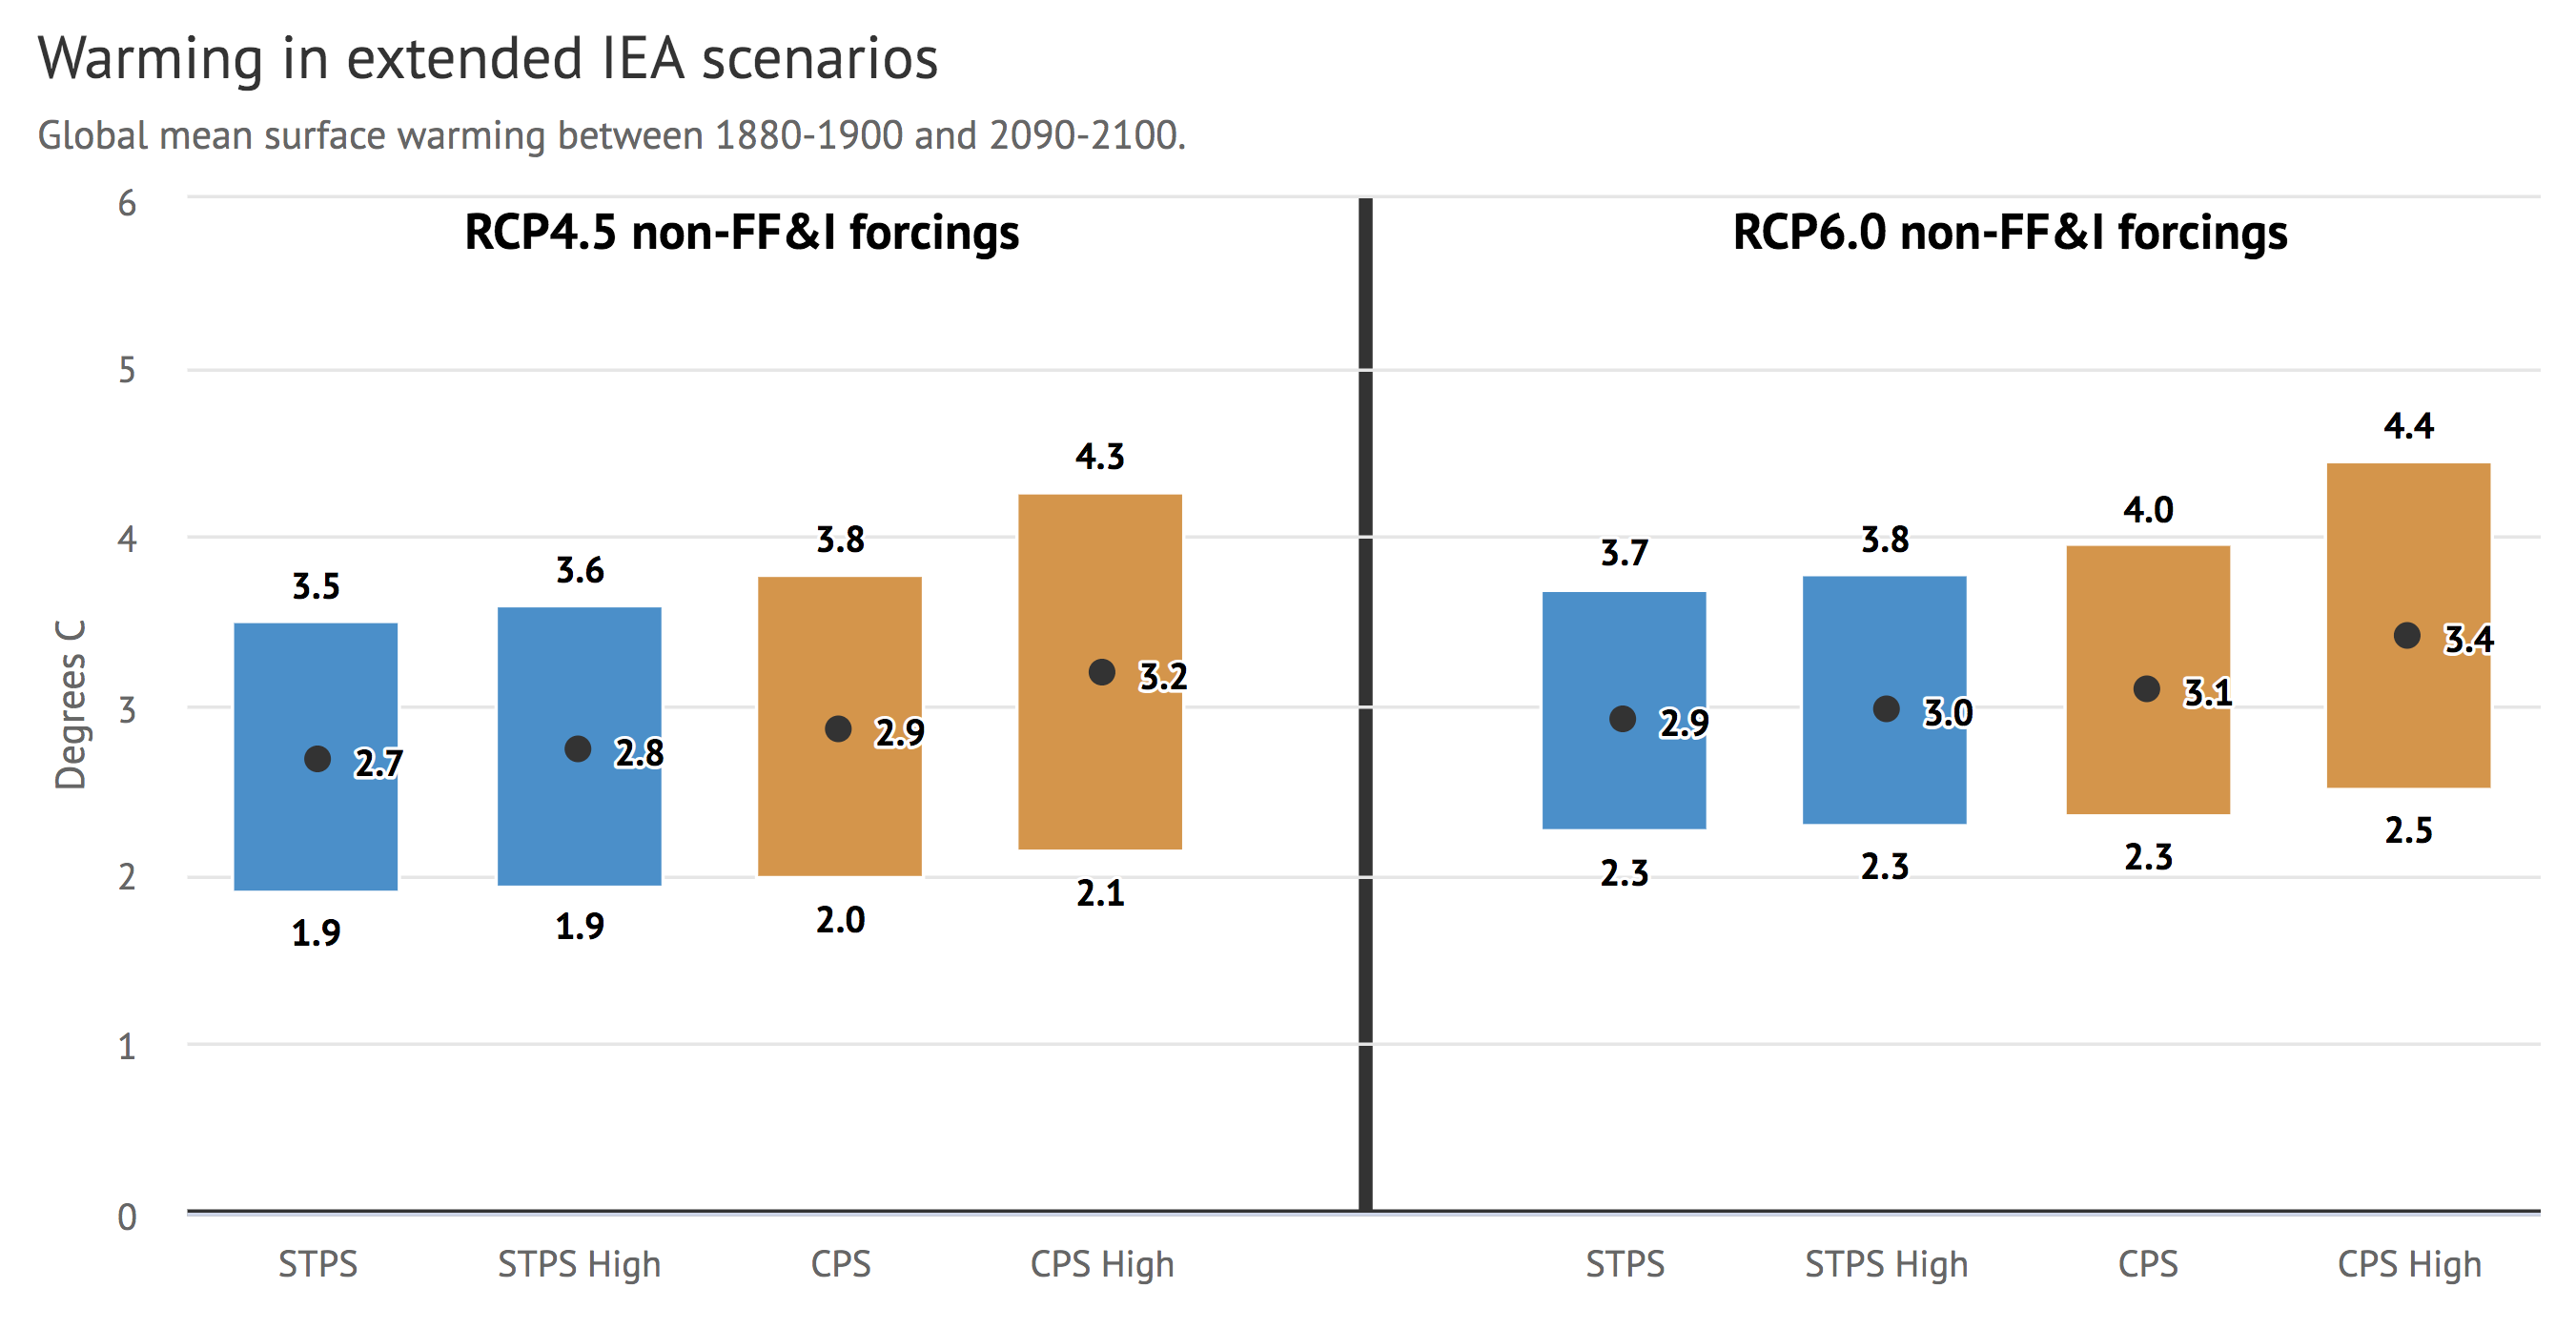
The left side of the figure shows warming in both STPS and CPS based on FF&I cumulative emission differences from SSP2-4.5, and adding this to the warming in RCP4.5 (e.g. effectively using non-FF&I forcings from RCP4.5). The STPS High and CPS High variants show cases where emissions continue to increase at the 2030-2040 rate for the remainder of the 21st century rather than assuming flat emissions after 2040. The right side of the figure shows similar values, but using SSP4-6.0 cumulative emission and RCP6.0 as the base scenario rather than SSP2-4.5/RCP4.5.
We find that under either set of assumptions, extended IEA scenarios imply that a most likely warming of around 3C, ranging from 2.9C to 3.4C for CPS and 2.7C to 3C for STPS. Accounting for uncertainties in climate sensitivity, the full range of likely future warming under these scenarios is between 1.9C and 4.4C. These numbers are reasonably consistent with projections in the recent UNEP emissions gap report, which suggests that implementing Paris Agreement commitments would result in warming of around 3.2C above pre-industrial levels in the year 2100.
Better or worse outcomes are possible
There is a strong case to be made that transitions in the global energy system over the past decade mean that a conservative business-as-usual projection of current trends in the energy system continuing is now likely to lead to warming of around 3C by 2100. At the same time, projecting future emissions over the next 80 years is inherently uncertain. It is increasingly difficult to envision the 500% increase in global coal use required by the SSP5-8.5/RCP8.5 scenario in light of growing acknowledgement of effects on air pollution, falling costs of clean energy alternatives and substitutes like natural gas, and current energy system plans. However, it is certainly possible to imagine a world with higher future emissions than those considered by the IEA.
For example, a SSP3-style world of resurgent nationalism, isolationism, and conflict with high population growth, inequality, and low rates of technological development could result in a modest return to coal and warming of around 4C by 2100. These types of worst-case energy and socioeconomic scenarios need to be considered, but should not necessarily be used as the default scenarios in climate impact analyses, or implied as the most likely future climate trajectory. Similarly, uncertainties in carbon cycle feedbacks mean that the amount of warming could end up higher than expected in lower emission pathways, though carbon cycle uncertainties are better considered through climate model experiments than purposefully-unrealistic future emissions scenarios that are hypothetical approaches to framing what-if possibilities.
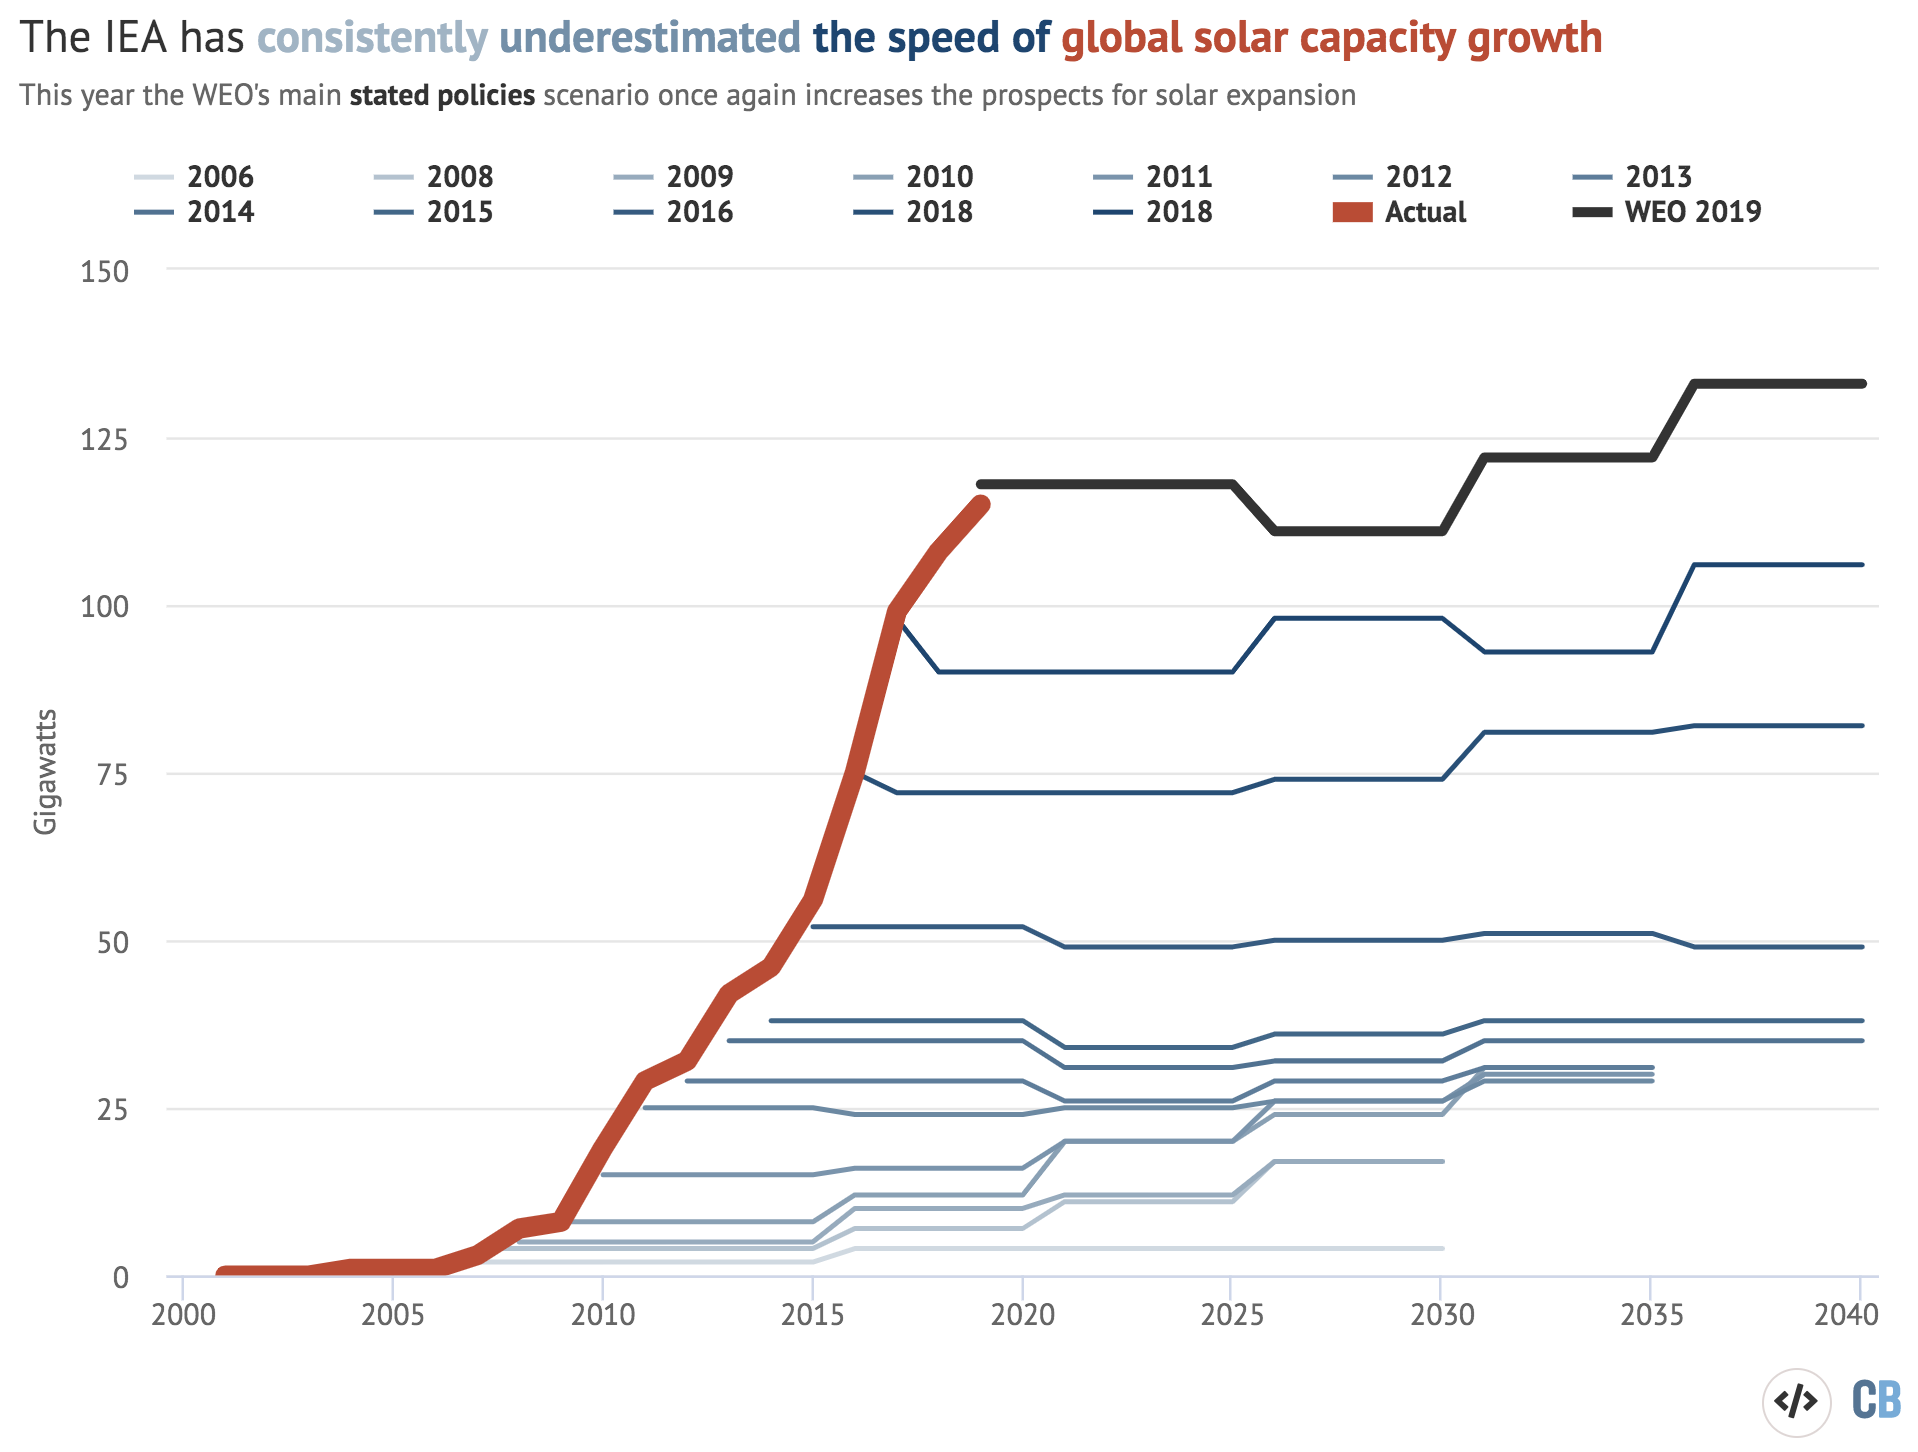
At the same time, it is likely possible for the world to reduce emissions below 2040 levels by the end of the century even in the absence of additional climate policies. For example, the same IEA scenarios that suggest the world is on track for around 3C warming are often criticized as being too conservative regarding renewables. The figure below shows the IEA’s forecast of solar capacity growth in the STPS scenario for each World Energy Outlook report between 2006 and 2018. It is clear that the past reports have substantially underestimated the rate of solar capacity additions, and even the current projection of relatively flat capacity additions through 2040 may be too low.
Future technological innovation could continue to drive down the costs of both clean energy and electric vehicles even in the absence of new climate policy. It may be possible under an optimistic business-as-usual case to have as little as 2.5C warming by the end of the century, though anything below that is very unlikely to happen in the absence of policy given the rate of emissions reductions required, especially if emissions do not peak until 2040 as in the IEA scenarios.
These two contrasting possible futures set up a tension for advocates expressing optimism for clean energy but also using climate impact estimates based on very-high emission baselines. A world where coal use could expand enough to reach SSP3-7.0 (or even SSP5-8.5/RCP8.5) levels is one of very slow growth in renewable energy, nuclear, or other decarbonization technologies. Similarly, a world where clean energy outcompetes deployment of new fossil technologies is one where it is difficult to envision emission scenarios much above SSP4-6.0/RCP6.0. While there is some utility in having “what might have been” scenarios that are radically divergent from the path we’re on today, these should not be used to set policy or plan for future climate impacts.
The fact that the current policy projections are on the bottom of the range of baseline scenarios in the literature is problematic if not taken into account when using baseline scenarios as a roadmap for climate policies going forward. The benefit of having regularly updated energy models like the IEA WEO is that they can be much more responsive to recent trends in costs and deployment than energy system models initialized in 2005 or 2010 used in IPCC assessments. The world has taken concrete steps to move away from coal in the past decade, and this progress should be reflected in our assessment of likely emissions pathways — and their resulting climate impacts — going forward.