A Major Paper on Liquified Natural Gas Emissions Is Riddled with Errors
Reviewing Robert Howarth’s Most Recent Work
-
-
Share
-
Share via Twitter -
Share via Facebook -
Share via Email
-
In January 2024, the Biden Administration announced a temporary pause on new export license applications for liquified natural gas (LNG) export terminals, pending a review by Department of Energy (DOE) national laboratories of the climate and economic impacts of U.S. LNG. The decision came roughly one month after a public letter, signed by over 100 academics, implored that President Biden reject the proposed Calcasieu Pass 2 (CP2) LNG export terminal in Louisiana, projected to become the largest in the U.S., and other pending terminal applications. Last month, however, the Federal Energy Regulatory Commission voted two to one to approve the CP2 facility, now passing on final license approval to the DOE. And earlier this month a Louisiana judge granted a preliminary injunction to put the Biden Administration’s LNG pause on hold.
Among the signatories of the letter was Robert Howarth, a professor of Ecology at Cornell University, who has, for over a decade, wrongly claimed that domestic natural gas contributes just as much, or even more, to global warming as coal. That letter—as well as a letter from over 60 members of Congress to Secretary of Energy Granholm—references a recent study authored by Professor Howarth—posted as a preprint in October 2023—that claimed that U.S. LNG has a higher greenhouse gas (GHG) emission intensity than coal power. The most recent update of the study from May 2024—the study has been amended several times since its initial release—estimates that U.S. LNG emits approximately the same GHG emissions as coal on the lower end, and as much as 64% more GHGs on the upper end, on a 100-year time frame.
Only in the past decade has U.S. LNG become significant in the global energy trade. At the outset of the 2000s, U.S. energy analysts anticipated domestic gas supply constraints and planned for LNG import terminals. Two decades later, on the back of the shale gas revolution, the U.S. is now the global leader in LNG exports.
Domestically, the shale revolution was the primary driver of the marked displacement of U.S. coal power production, shrinking coal power from 43% of nationwide generation in 2011 to 16% today and reducing emissions not just in the power sector, but across the broader economy.
Despite this success story, dubious published analyses and claims in public-facing news outlets have long cast doubt on natural gas's climate advantage over coal power. The technical basis for these assertions, which have drawn push back, revolves around largely incorrect interpretations of the scientific literature on methane leakage rates.
Natural gas is primarily composed of methane, a GHG with 82.5 times more global warming potential than carbon dioxide (CO2) on a 20-year time frame (GWP20) and 29.8 times on a 100-year time frame (GWP100). The residence time of methane in the atmosphere is only 11.8 years before oxidizing into CO2, whereas CO2 persists in the atmosphere for centuries.
In recent years, many high-quality research papers have measured fugitive methane emissions in U.S. shale basins, finding leakage rates higher than previously estimated by the Environmental Protection Agency (EPA). These reports are cause for concern and have rightly galvanized cross-cutting efforts across academic institutions, NGOs, the private sector, European LNG importers, and U.S. public agencies. But these higher-than-expected leakage rates do not negate the relative emissions benefits of switching from coal to gas power domestically.
But domestic considerations are only part of the story. How, Howarth’s study asks, do recent studies on methane leakage affect the climate calculus of U.S. LNG exports?
Howarth—convinced by environmental activist Bill McKibben to release his study as a preprint to influence the Biden Administration—insists that U.S. LNG, despite evidence to the contrary, is worse than coal. His latest study, promoted prominently in major media outlets and by McKibben in his column for the New Yorker, uses incontrovertibly flawed methodology to once again assert his claim.
That an activist scholar with a history of contested and critiqued claims could influence the Biden administration with such an obviously erroneous study is more than concerning. It demonstrates how faulty science in the name of climate can derail important policy debates, and make the global energy transition far harder.
Bad LCA in, bad policy out
Howarth’s study performs a life cycle assessment (LCA) of the GHG intensity of U.S. LNG for overseas power production. It tallies all the GHGs emitted throughout the supply chain to calculate the total amount of GHGs emitted and their CO2 equivalence (CO2 eq) per unit of LNG.
Howarth’s emissions estimates are much higher than most other LCAs of U.S. LNG in the literature. Figure 1 shows a high-level comparison of the GHG intensity of U.S. LNG for electric power production according to: 1) Howarth’s March 2024 and May 2024 models, 2) a corrected methodology of this model for gas sourced from the Permian and Marcellus shale formations, 3) literature LCA estimates, and 4) other energy sources in importing countries. Importantly, Howarth presents his LCA in terms of the thermal fuel energy as opposed to the electrical energy generated, which means his analysis does not capture the superior energy efficiency of natural gas power plants compared to coal-fired power plants, which was identified as one of the most significant variables in the DOE’s 2019 National Energy Technology Laboratory (NETL) report (Roman-White et al., NETL (2019) in Figure 1). For example, the values reported in Rosselot et al. (2021) and shown in Figure 1 are elevated compared to other literature reports because of a significantly lower assumed natural gas power plant efficiency (28.8% and 40.8% v.s. 46.4%).
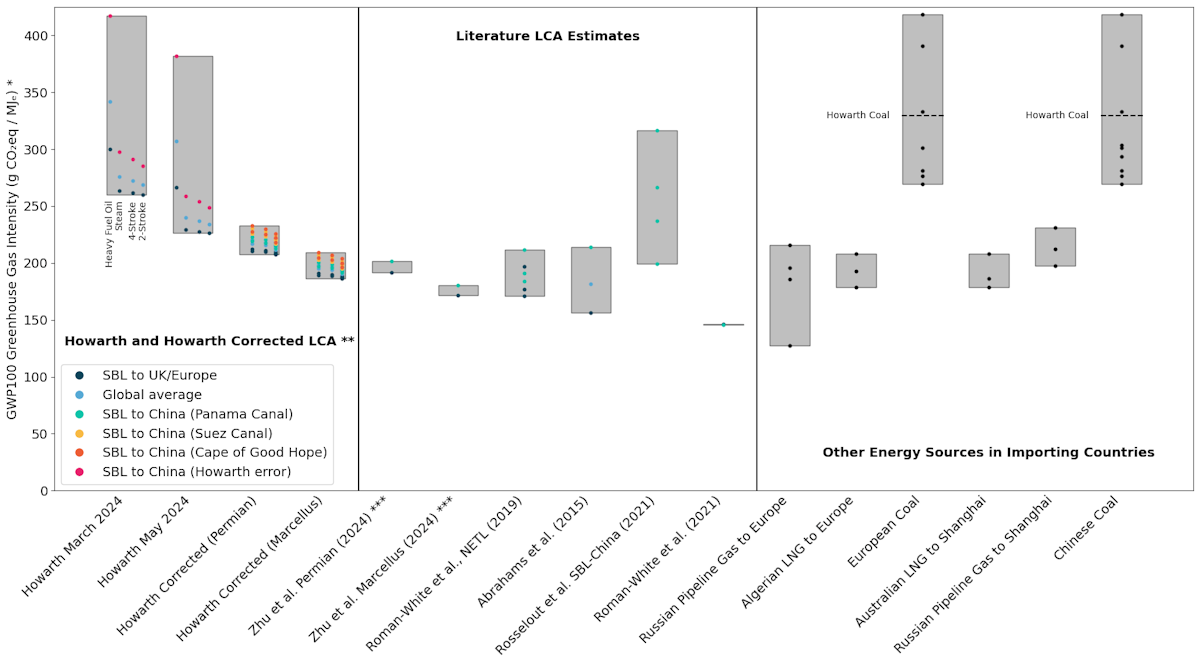
Howarth argues that other literature estimates use outdated EPA methane leakage rates and do not take into account the more recent data in the peer-reviewed literature. With a few exceptions—including an excellent recent preprint LCA by Zhu et al. at the University of Texas at Austin and two 2021 papers in ACS Sustainable Chemistry & Engineering by Rosselot et al. and Roman-White et al.—Howarth is mostly right on this point. What explains the vast majority of the delta between Howarth and the rest of the literature is his assumed upstream and midstream methane leakage rates.
However, Howarth’s study is riddled with errors. Let’s take a closer look at Howarth’s errors in turn:
1. Sourcing natural gas for LNG
Up until the latest version of his manuscript, Howarth assumed a 4.6% methane leakage rate from upstream & midstream natural gas processes, citing an article in Nature by Sherwin and colleagues. The paper reported on a comprehensive aerial surveillance campaign of methane emissions in six regional oil and gas basins across the US. Specifically, Howarth cites the reported production-weighted average methane leakage rate, excluding a high-production, low-leakage subregion shale basin in Pennsylvania, which is reported by Sherwin et al. to have an average methane leakage rate as low as 0.75%. Howarth justified using 4.6% instead of the overall average given by Sherwin et al. of 2.95% because most LNG export terminals are based in Texas and Louisiana.
The implication is that LNG export terminals on the Gulf Coast cannot source natural gas from Appalachian basins such as the Marcellus or Utica shale. But, of course, it was the rapid growth in production from these very basins that spurred the growth in LNG exports from the Gulf Coast circa 2016. Several existing pipelines (e.g., Transcontinental, Columbia Gulf, and Texas Eastern) and the newly operational and much-contested Mountain Valley Pipeline facilitate natural gas transport between these regions (some 10.8 billion cubic feet per day, which is only slightly less than the total U.S. LNG export capacity). That said, it is widely expected that a lack of midstream pipeline infrastructure projects in the mid-Atlantic region will bottleneck additional growth of natural gas supplies from the Appalachian basins for LNG export from the Gulf Coast. Nevertheless, entirely ignoring the low-emissions profile gas from the most productive gas-producing region in the US, which does supply gas for LNG, is questionable at best.
2. Upstream & midstream emissions allocation
Where Howarth seriously blundered, though, and what is clearly incorrect about the versions of his preprint that were referenced by Mckibben, congressional representatives, and in the letter to President Biden, is his attribution of 100% of the reported methane emissions to natural gas production. But the cited figure from Sherwin et al. reflects upstream and midstream methane leakage associated with both oil and gas production wells as well as midstream gas processing facilities and pipelines.
Sherwin and coauthors clearly write in their paper that “these loss rates should not be used directly in life-cycle assessment [LCA] without first accounting for the oil produced alongside natural gas.” Howarth committed exactly this mistake. The correct approach—and the method that Sherwin et al. explicitly instruct users of their data to adopt—is to allocate fugitive methane emissions to both oil and gas, weighted by the respective energy content of oil and natural gas production in particular basins.
This is not a trivial error. This earlier version of Howarth’s methodology implicitly assigns either no methane leakage to oil production or double counts those methane emissions for oil and gas production—both obviously wrong approaches. And this mistake becomes especially problematic given that LNG export terminals in Texas and Louisiana, moving forward, will predominantly—and in Howarth’s study, exclusively—source natural gas from the proximately located Permian and Haynesville basins, the former being a primarily oil-producing region.**
Indeed, Sherwin and colleagues elaborate in the article’s supporting information that “failure to apply such an emission allocation method across both produced natural gas and oil can result in considerable double counting in life-cycle assessment efforts.”
Zhu et al. stress that emission allocation methodology is the most significant factor in their LCA analysis of the Permian-China LNG supply chain and that committing Howarth’s mistake increases the GHG intensity by 49%. Rosselot et al. report similar findings.
In the course of writing this commentary, Howarth meanwhile updated the manuscript on his website and posted the new version on Twitter, commenting that he had made “modest revisions” due to comments from peer reviewers.
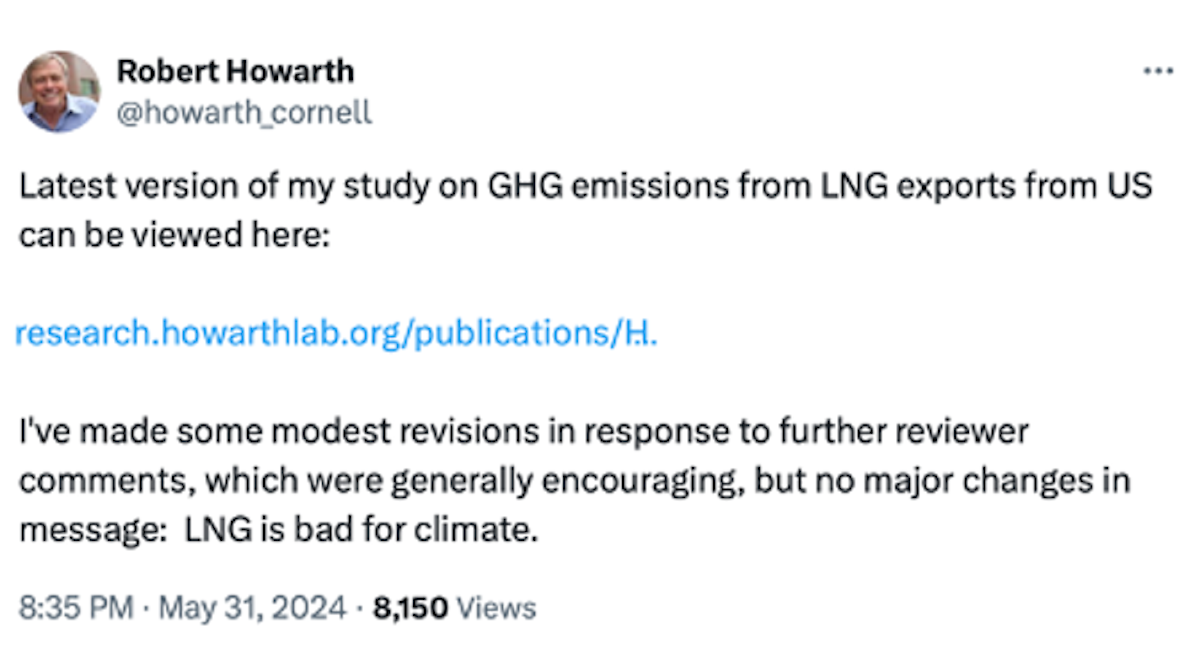
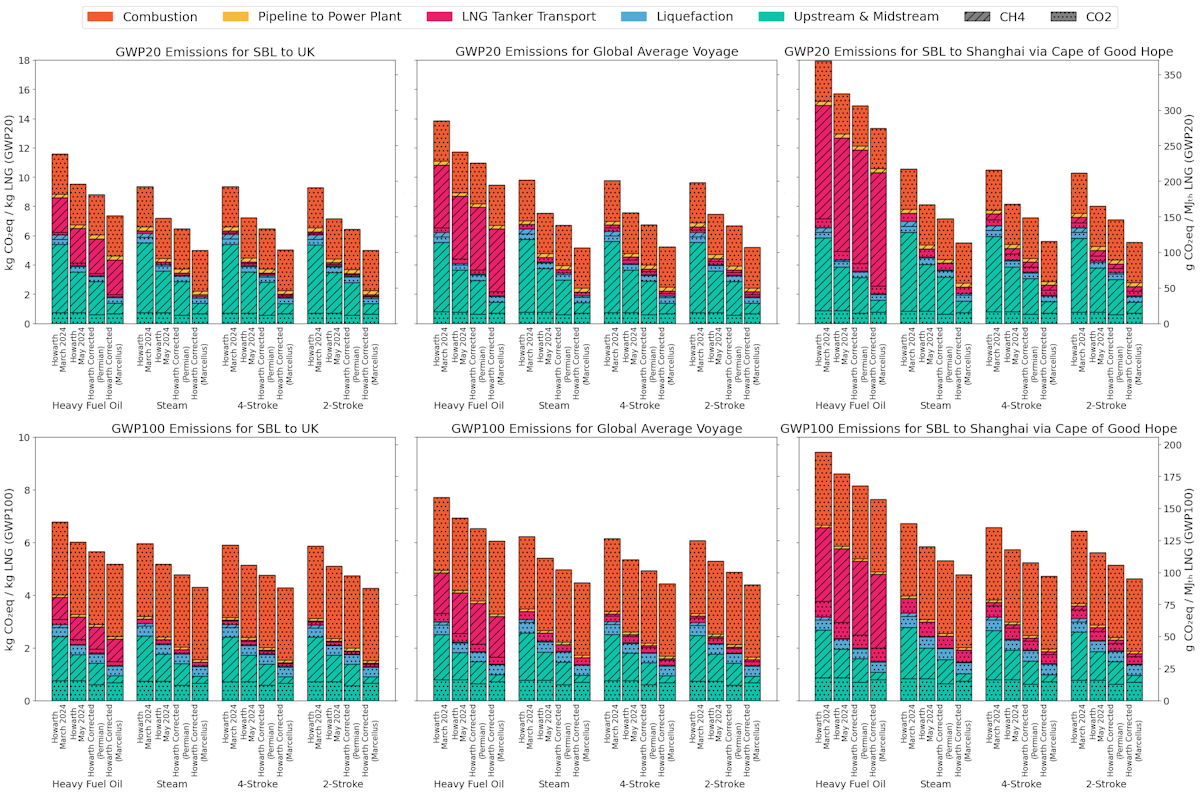
In actuality, these “modest revisions” partly addressed a significant and fundamental error in his methodology. By erroneously using Sherwin et al.’s methane emissions data alone, Howarth had overestimated the GHG intensity of delivered U.S. LNG by 26% to 72% on a 20-year basis and 21% to 47% on a 100-year basis. Taking into account other errors made elsewhere in Howarth’s analysis, his total magnitude of overestimation of delivered U.S. LNG rises to 32% to 84% for GWP20 and 30% to 61% for GWP100, as shown in Figure 2. These calculations stem from a replication of Howarth’s model using his own methodology for different scenarios as presented in his March 2024 update, May 2024 update, and a corrected version of his model for gas sourced from the Permian and Marcellus shale basins—results are discussed in more detail throughout the rest of this article.
And while, for the most part, Howarth’s updated manuscript addresses this methane leakage attribution issue in response to peer review feedback, Howarth presents his corrected methane leakage attribution calculations in a convoluted way without explanation. In reviewing the updated manuscript and supplementary information of Sherwin et al. (supplementary tables S10, S12, and S24), I replicated Howarth’s model and his updated calculations of the average methane leakage of 2.76% (rounded to 2.8% in Howarth’s Supplemental Table A as of May 2024). The attribution calculations improved the analysis, but while distinguishing between oil and gas production is a start, a more rigorous calculation would further distinguish between all associated energy products: crude oil, lease condensate, processing plant condensate, natural gas liquids, and dry gas. Only the lattermost—dry gas—serves as input content for LNG production. Moreover, similar attribution should also apply to upstream CO2 emissions, not just methane leakage—a correction that Howarth’s latest version still omits. In my corrected version of Howarth’s model, I implement these methodologies as Zhu et al. have done.
Per reviewer comments, Howarth draws on supplementary data from Sherwin et al. to distinguish between methane emissions from upstream production wells and midstream facilities (supplementary tables S10 and S12). He further draws on the provided production data (supplementary table S24), which estimates oil and natural gas production for each production basin concurrent with the methane leakage measurements. Note that for three 2019 measurements in the Permian reported by Sherwin et al., the authors do not provide oil and gas production data. Although Howarth does not specify his methodology, he almost certainly used an average of the percentage of oil and gas production from the other measurements in the Permian. I follow this same approach in my “Howarth Corrected” methodology (see supplemental materials B).
With these data, Howarth attributes methane leakage from upstream production to natural gas on an energy-content-weighted basis and assigns all leakage from midstream facilities to natural gas for LNG. This is mostly correct. However, unlike the more rigorous analysis of Zhu et al., Howarth considers all gas output to be converted to LNG. But as Zhu et al. detail in their analysis (supplementary table 33), on average, only 74.3%, by energy content of natural gas output from the Permian, is the dry gas input for LNG production. The other components (e.g., processing plant condensate and natural gas liquids) of the gas output are converted to other energy products and should, therefore, share in the attribution of midstream methane emissions proportional to energy content. In my “Howarth Corrected” methodology, I assign 74.3% of the midstream methane leakage to dry gas for LNG production for each of the listed Permian basin measurements reported by Sherwin et al. (supplementary tables S10, S12, and S24) and take a methane-production-weighted average of the resulting leakage rates to obtain an effective average methane leakage rate of 2.28% (see supplemental materials B).
Howarth also assumes 612 grams of CO2 per kg of LNG (g CO2 / kg LNG) from upstream and midstream activities, citing a 2023 report appendix from the state of New York. The GHG intensity from “extraction, production, and transmission of fossil fuels imported into New York State,” is listed as 12,272 grams of CO2 per MMBtu of imported natural gas. Converting that figure to Howarth’s preferred units of g CO2 / kg LNG and using Howarth’s provided lower heating value gravimetric energy density of 48.6 MJ / kg LNG, one calculates 565 g CO2 / kg LNG for the Permian basin, not 612. For comparison, converting Howarth’s 612 g CO2 / kg LNG in terms of MJ results in 12.59 g CO2 / MJ LNG, which is 2.26 times higher than the bottom-up estimate for the Permian LNG supply chain provided in Zhu et al. of 5.5671 g CO2 / MJ LNG.
Moreover, not all of these emissions should be attributed to LNG. The CO2 emissions allocation methodology I adopt for the “Howarth Corrected'' model is based on a reconstruction of the calculations in Zhu et al., where different processes are tabulated and emissions are assigned either 100% to dry gas, 74.3% to dry gas (midstream processing), or 31.3% to dry gas (upstream fuel use for well-drilling and production activities). The resulting value is 492 g CO2 / kg LNG or 11.63 g CO2 / MJ LNG (see supplemental materials C), which is still 1.8 times higher than the Zhu et al. estimate of 5.5671 g CO2 / MJ LNG. Therefore, my adjustment still represents a relatively pessimistic estimation of upstream and midstream CO2 .
3. Fugitive pipeline methane emissions abroad
Another issue is Howarth’s citation of a 2018 paper in Science by Alvarez et al. in which Howarth assumes a methane leakage rate of 0.32% in destination country pipeline infrastructure between regasification and power plant facilities. Except, that article is on methane emissions within the U.S. oil and gas supply chain, not from pipelines abroad, and nowhere in the main text or supplementary information is the figure 0.32% mentioned. Howarth does not specify details on his derivation. The fugitive methane losses from domestic pipelines from the 2019 Department of Energy NETL report is between 0.27% and 0.31%. The NETL report does not consider methane leakage in importing countries. I have used Howarth’s value in my “Howarth Corrected” scenario methodology.***
4. Mistaken LNG shipping distances
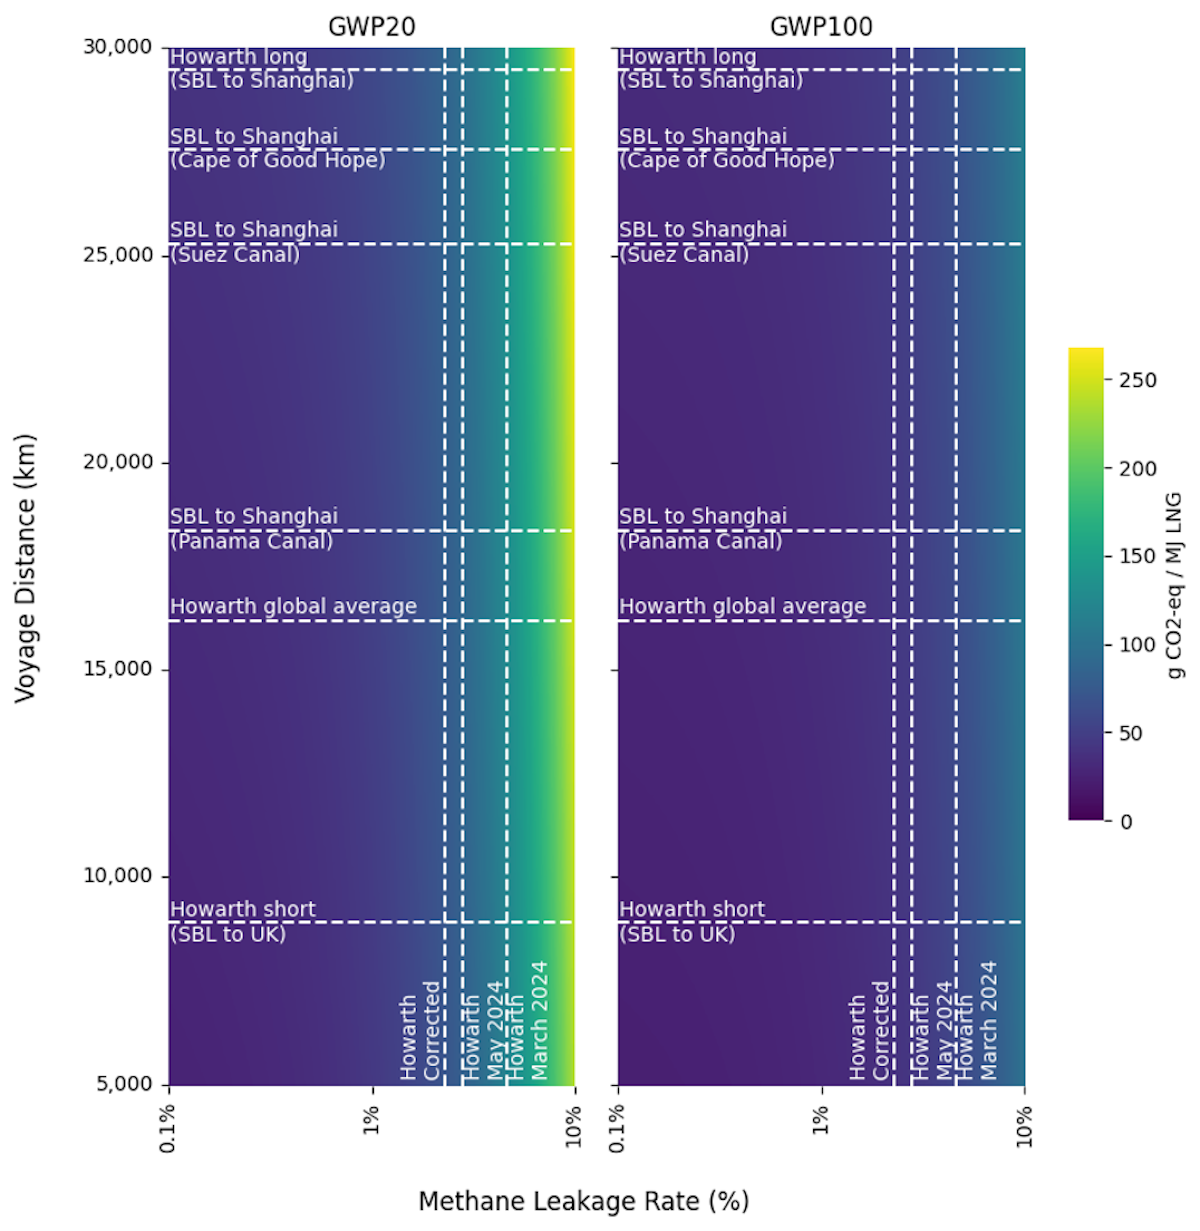
Howarth’s analysis considers three different LNG shipping distances (the distances are doubled to account for the return journey), citing a 2018 Oxford Institute for Energy Studies report. Howarth’s middle-of-the-road estimate is the assumed average global LNG voyage distance (16,200 km). The shortest and longest routes both originate at the largest U.S. export terminal, the Sabine Pass Liquefaction (SBL) facility in Louisiana, and terminate in the United Kingdom (9,070 km) and in Shanghai, China (29,461 km), respectively. Except the latter figure (29,461 km) is simply incorrect. The Oxford study reports SBL to Shanghai shipping distances in nautical miles (nm) via the Panama Canal, Suez Canal, and the long way around Africa via the Cape of Good Hope. Howarth’s listed 29,461 km figure converts to 15,908 nm. But that value is not even listed in the cited table. The longest SBL to Shanghai distance provided is 15,098 nm via the Cape of Good Hope route. Howarth appears to have accidentally swapped the 9 and 0, mistakenly adding 810 nm to the already longest route.
Howarth justifies his high upper bound voyage distance pointing to reduced passage of LNG tankers through the Panama Canal due to recent droughts. While this is no doubt true, the referenced drought is due to the recently concluded intense El Niño weather cycle and likely not a trend induced by global warming in this particular region. In other words, one should not expect this drought to become markedly more frequent moving forward. For comparison, the SBL to Shanghai voyage via the Panama Canal and Suez Canal correspond to 10,081 nm and 13,854 nm or 18,670 km and 25,658 km, respectively. And while it is true that delays at the Panama Canal, coupled with escalating threats to maritime shipping from Houthi militias in the Red Sea off the coast of Yemen, have diverted a significant number of ships, including LNG tankers, to the longer route around the Cape of Good Hope, one should not necessarily expect these patterns to persist. In all likelihood, the direct route through the Panama Canal—only slightly longer than Howarth’s middle-of-the-road shipping distance scenario—is likely to remain the dominant SBL to Shanghai route in the future. Regardless, the actual upper bound figure Howarth uses in his study includes a mistake of 810 nm (1500 km). For my “Howarth Corrected” methodology in Figure 2, I use the correct Cape of Good Hope route distance as my upper bound. These results should represent an absolute upper bound and are somewhat lower if the Panama Canal route is assumed instead. All relevant shipping route distances are specified as horizontal dashed lines in Figure 3.
All that said, when replicating his methodology using the “Howarth Corrected” scenario but treating the effective upstream and midstream methane leakage rate and shipping distance as free parameters, as shown in Figure 3, it clear that that for delivered LNG GHG intensity, shipping distance is nowhere near as significant as leakage rates.
5. LNG tankers: size, cargo, and methane slip
Howarth also considers four different types of LNG tankers powered by either heavy fuel oil or natural gas. Ships that burn natural gas utilize the gas that boils off from the LNG, which is kept very cold to remain in the liquid phase, but some portion inevitably regasifies. Howarth further considers three different engine types for tankers that burn gas: steam-powered, 4-stroke, and 2-stroke engines.
While steam-powered ships are less energy efficient than 4-stroke and 2-stroke engines, they have negligible methane slip—the percentage of methane not burned in the engine and released as exhaust to the atmosphere. But all of the natural gas-powered vessels are much more efficient than ships run on fuel oil. And since the latter burn fuel oil, LNG that boils off is assumed to be directly released to the atmosphere (modern ships have regasification systems), significantly increasing the upper bound GHG intensity in Howarth’s results. These older ships are being phased out, do not make up a significant proportion of the existing fleet, and will be a negligible portion moving forward.
In Howarth’s results, LNG tankers that burn natural gas deliver LNG with nominally similar GHG intensity. However, the industry has begun incorporating high-pressure 2-stroke engines, which could have a methane slip as low as 0.19%, compared to contemporary 4-stroke and low-pressure 2-stroke engines, which are estimated in Howarth’s LCA to have a methane slip of 3.1% and 3.8%, respectively. According to the International Gas Unions’s 2024 LNG report and Rystad Energy, recently manufactured and soon-to-be delivered tankers are predominantly low-pressure 2-stroke gas-powered engines.
But the mistakes and pessimistic assumptions in Howarth’s paper do not end there. Two relevant parameters in LNG LCA analysis are the assumed LNG tanker cargo capacity and the ballast heel, which is the proportion of LNG cargo that is not unloaded at the destination port and is needed to power the tanker for the return (i.e., ballast) voyage and to keep the LNG tanker chambers cold.
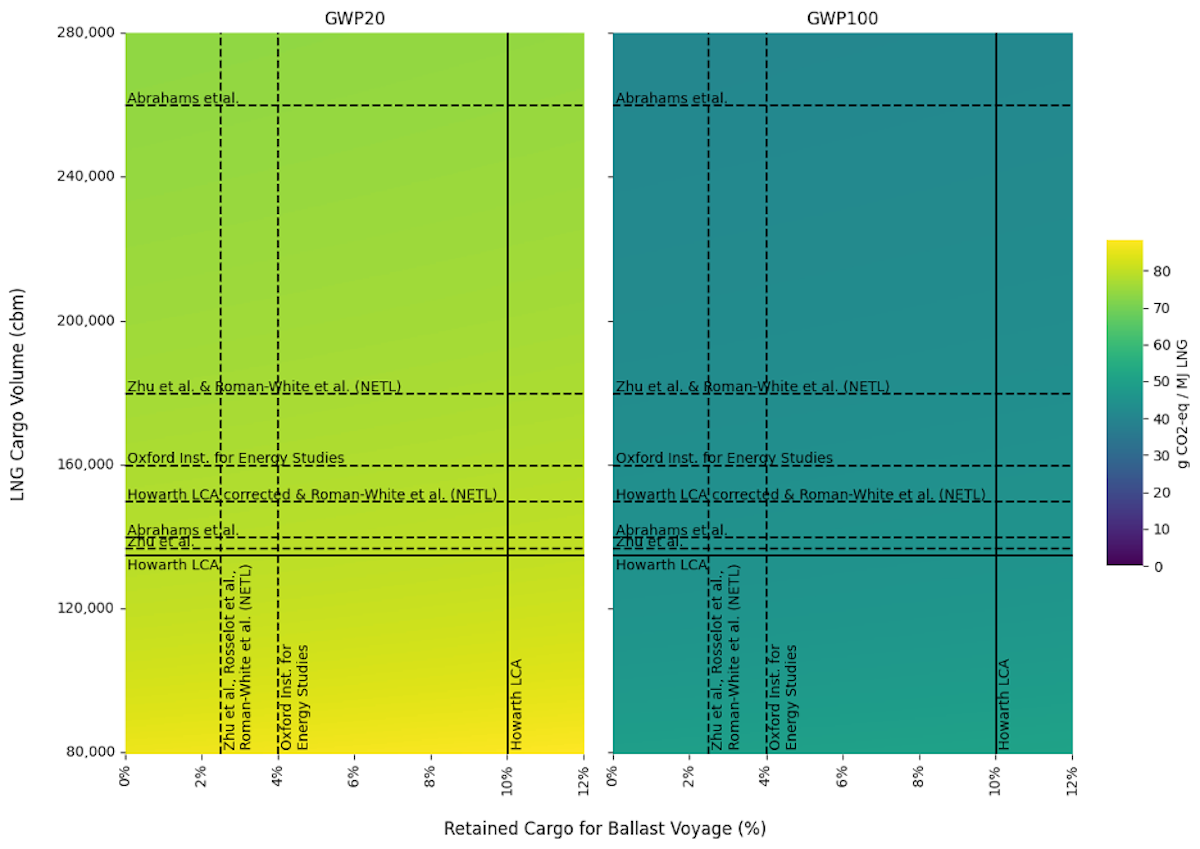
Howarth assumes an LNG capacity of 135,000 cubic meters, which is on the lower end of the available literature estimates (shown as horizontal lines in Figure 4) and the average capacities of the current fleet (roughly 150,000 to 180,000 cubic meters). Historically, LNG tanker capacities were suppressed due to size limitations to transit through the Panama Canal, but due to recent upgrades, 174,000 cubic meters has been the most common newbuild size over the past decade. However, newer vessels scheduled to be delivered in the coming half-decade or so have significantly larger capacities in the range of ~175,000 to as high as 271,000 cubic meters. What’s more, to substantiate the 135,000 cubic meter estimate, Howarth cites a 2014 conference proceeding, which arbitrarily assumes 135,000 cubic meters of cargo for a tanker with 150,000 cubic meters of capacity. For my “Howarth Corrected” scenario, I use a capacity of 150,000 cubic meters, which is the lower bound in the 2019 DOE NETL report.
With regard to the ballast voyage heel, Howarth assumes 10% of LNG capacity is retained for the return voyage, and thus, only 90% of the cargo is delivered. This estimate, as shown by the vertical lines in Figure 4, is far above those in the literature (usually 2.5%) and no justification is provided in either of the versions of Howarth’s study for doing so.
The Oxford Institute for Energy Studies report, which Howarth cites in his study, assumes a 160,000 cubic meter vessel and a 4% heel. For my “Howarth Corrected” scenario, I assumed a 2.5% heel.
Howarth’s version of a sensitivity analysis is wanting. In his discussion of sensitivity, he leaves out both the assumed LNG capacity and ballast heel despite, for example, Abrahams et al.—whose results he claims are nominally in agreement with his—commenting that LNG tanker capacity is a more dominant figure than voyage distance or even fuel type in their LCA analysis of LNG.
To illustrate this point, I have included two versions of heatmap graphs in Figure 4, which plot the GHG intensity of delivered LNG for both a 20-year and a 100-year global warming potential using the “Howarth Corrected” scenario as a function of assumed ballast voyage heel percentage and LNG tanker cargo volume. We observe a modest decrease in overall GHG intensity for ships with larger cargo volumes for GWP20 but less of a noticeable impact for GWP100 calculations.
What should the Biden administration do?
There are reasonable arguments in favor of curtailing the growth in LNG exports. Certainly an idealized vision of a decarbonized global energy economy would have little room for LNG trade, although it is remarkably unlikely that such a scenario will transpire anytime soon and that U.S. LNG exports will not serve future demand.
Some have also argued that LNG exports expose domestic ratepayers to an emergent global natural gas market, which is both expensive and volatile. And while it is conceivable that such rapid growth in LNG exports could raise domestic natural gas prices, in recent years—with the brief exception of significant increases in LNG shipments to Europe in 2022 in response to Russia’s invasion of Ukraine—natural gas production has kept pace with rising exports, keeping prices low and trending downward. The extent to which this surge in gas production is tied to the relatively high oil price environment via associated gas from oil wells is worthy of further exploration.
But restricting LNG supply does not necessarily represent an effective decarbonization strategy. For example, volatile prices and unreliable delivery over the past few years due to LNG supply shortages have encouraged Pakistan to shift its energy policy in favor of domestic coal (with a high proportion being the most polluting lignite coal). Such forms of realist energy policy will increase emissions. And as Arvind Ravikumar pointed out in the MIT Tech Review earlier this year, “when the fuel is exported, the net climate impact depends on what it replaces in the importing country.” The analysis gets far more complicated when recognizing that U.S. LNG prices are unlikely to seriously compete with low-cost coal in many importing countries.
But while the question of what to do about U.S. LNG exports revolves simultaneously around values, pragmatism, geopolitics, and emissions calculus, the question of LNG’s emissions calculus itself is far more empirical and straightforward. When it comes to the carbon footprint of LNG, climate commentators have allowed flawed methodology to dominate the conversation for too long. Howarth has neglected to take accountability for his erroneous analysis, which was ubiquitously cited by journalists and even in congressional communiqué in favor of his preferred policy outcome. The forthcoming DOE report on the climate and economic impacts of U.S. LNG should heed to the best practices of the literature, as Howarth neglected to do, and consider realistic end-uses of U.S. LNG into their analysis.
One thing is for sure, both the past and present iterations of Howarth’s LCA study constitute no basis upon which to make energy policy, and the Biden administration would do well to refer to higher-quality studies in the literature and experts at the DOE in developing a sound LNG export policy.
*0/8/05/204 corrected average cited from Sherwin et al. "of 2.5%" to 2.95%
**8/21/2024 was changed from "which are primarily oil-producing regions.” to “the former being a primarily oil-producing region.”
***11/13/24 was changed from “For reference, the 2019 Department of Energy NETL report assumes 0.009% fugitive methane losses from importing country pipelines—two orders of magnitude less than Howarth. I have nevertheless used Howarth’s value in my ‘Howarth Corrected’ scenario methodology.” The figure 0.009% is the assumed methane leakage from regasification and was mistakenly mentioned as the assumed importing country pipeline leakage rate from the NETL report. The correct methane leakage rate for domestic pipeline transport of between 0.27% and 0.31% was derived from appendix tables A-1 and A-2 in the NETL report.