Human Deaths from Hot and Cold Temperatures and Implications for Climate Change
Given the large number of deaths affected by temperature, there is significant public and scientific interest in the impact of global warming on human mortality.
-
-
Share
-
Share via Twitter -
Share via Facebook -
Share via Email
-
Executive Summary
- Uncomfortable outdoor temperatures are a contributing factor in 1-10% of all premature deaths.
- For the majority of the time, most cities have colder temperatures than their local optimum temperature, or the temperature that minimizes the death rate in that area.
- It has been estimated that about 5.1 million excess deaths per year are associated with non-optimal temperatures. Of those, 4.6 million are associated with colder than optimum temperatures, and 0.5 million are associated with hotter than optimum temperatures.
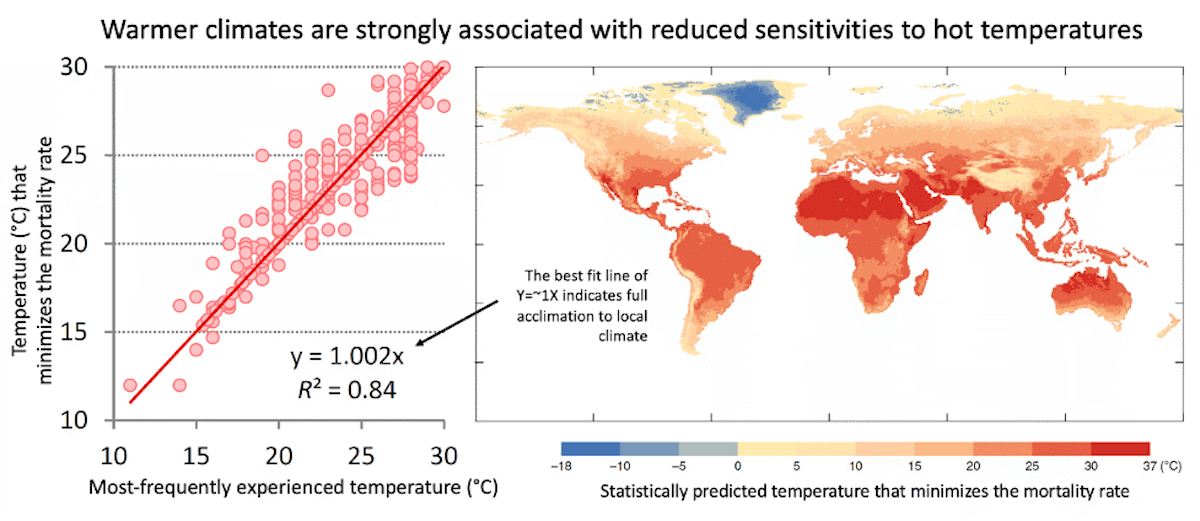
- The population of any given city is highly acclimated to local climatological temperatures. For example, the local optimum temperature has been found to be as much as 18°C colder in cold climates than it is in hot climates (Executive Summary Fig. 1).
- Deaths associated with non-optimal temperatures have been decreasing over time as it has gotten warmer partly due to a reduction in cold deaths. It has been estimated that warming from 2000 to 2019 has resulted in a net decline in excess deaths globally (a larger decrease in cold deaths than an increase in heat deaths).
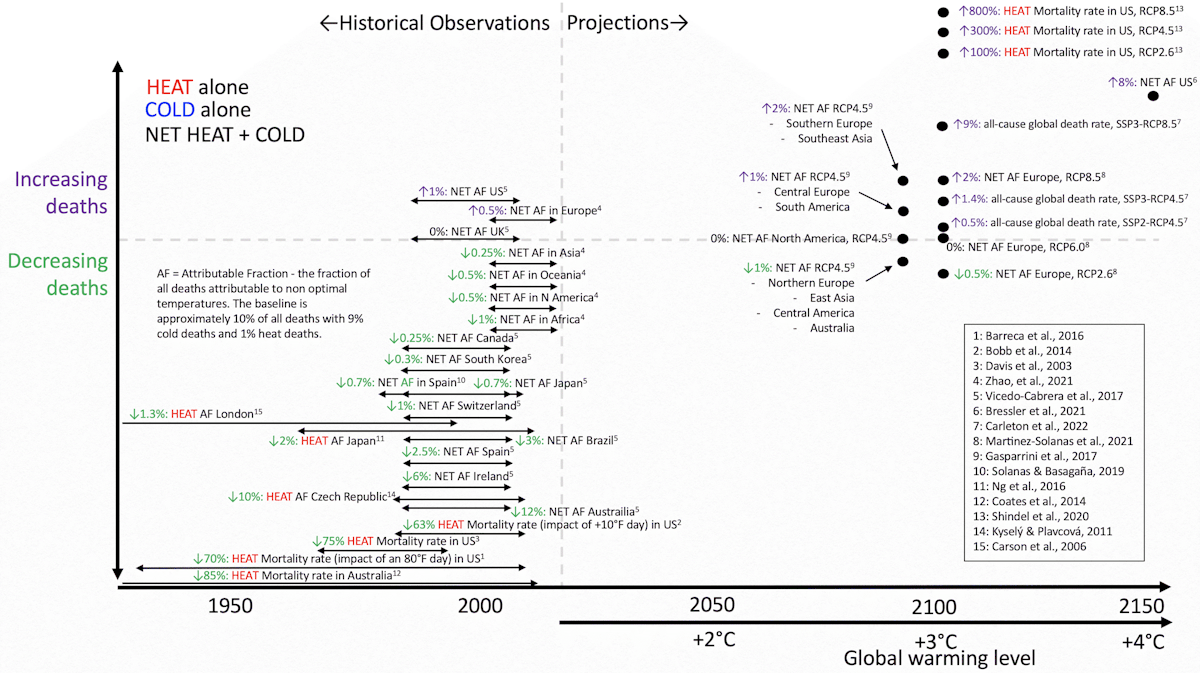
- Even isolating deaths associated with heat, in most locations, deaths have been decreasing over time despite warming (Executive Summary Fig. 2).
- Adoption of air conditioning and insulation is a major factor that reduces sensitivity to non-optimal temperatures, but other factors (urban characteristics, access to health care, occupational distribution, behavior, information, etc.) appear to be important as well. People in higher-income countries are more resilient to non-optimal temperatures because of greater access to many of the aforementioned resources.
- Despite historical trends showing declines in deaths from non-optimal temperatures, most studies that make future projections tend to indicate increases in deaths over the remainder of the century - though estimates vary widely. Such projections underpin many estimates of how much economic and social damage climate change will cause.
- The reason for disagreement on the magnitude of projected future death rates is a thorough lack of consensus on how to estimate adaptation and changes in resilience. Some projections assume zero change in resilience and no adaptation, and most projections assume that changes in temperature will predominate over changes in resilience. Given that this is the opposite of what has been observed historically, the credibility of these projections is questionable.
- The primary underpinnings for the strong acclimation across space in the present climate and increased resilience across time should be paramount research priorities going forward so that public resources can be best allocated toward the causes that most effectively increase adaptation and resiliency as the climate continues to warm.
Introduction
Humans are most comfortable in air temperatures in the low 70°s Fahrenheit or low 20°s Celsius. Significant deviations from these temperatures (in either the hot or cold direction) result in stress on the human body that affects health and even plays a contributing role in many deaths. The fraction of people who die exclusively from heat stroke or hypothermia is small, but ambient temperature can be considered to have been a factor in 1-10% of all human deaths (Sera et al., 2019; Zhao et al., 2021).
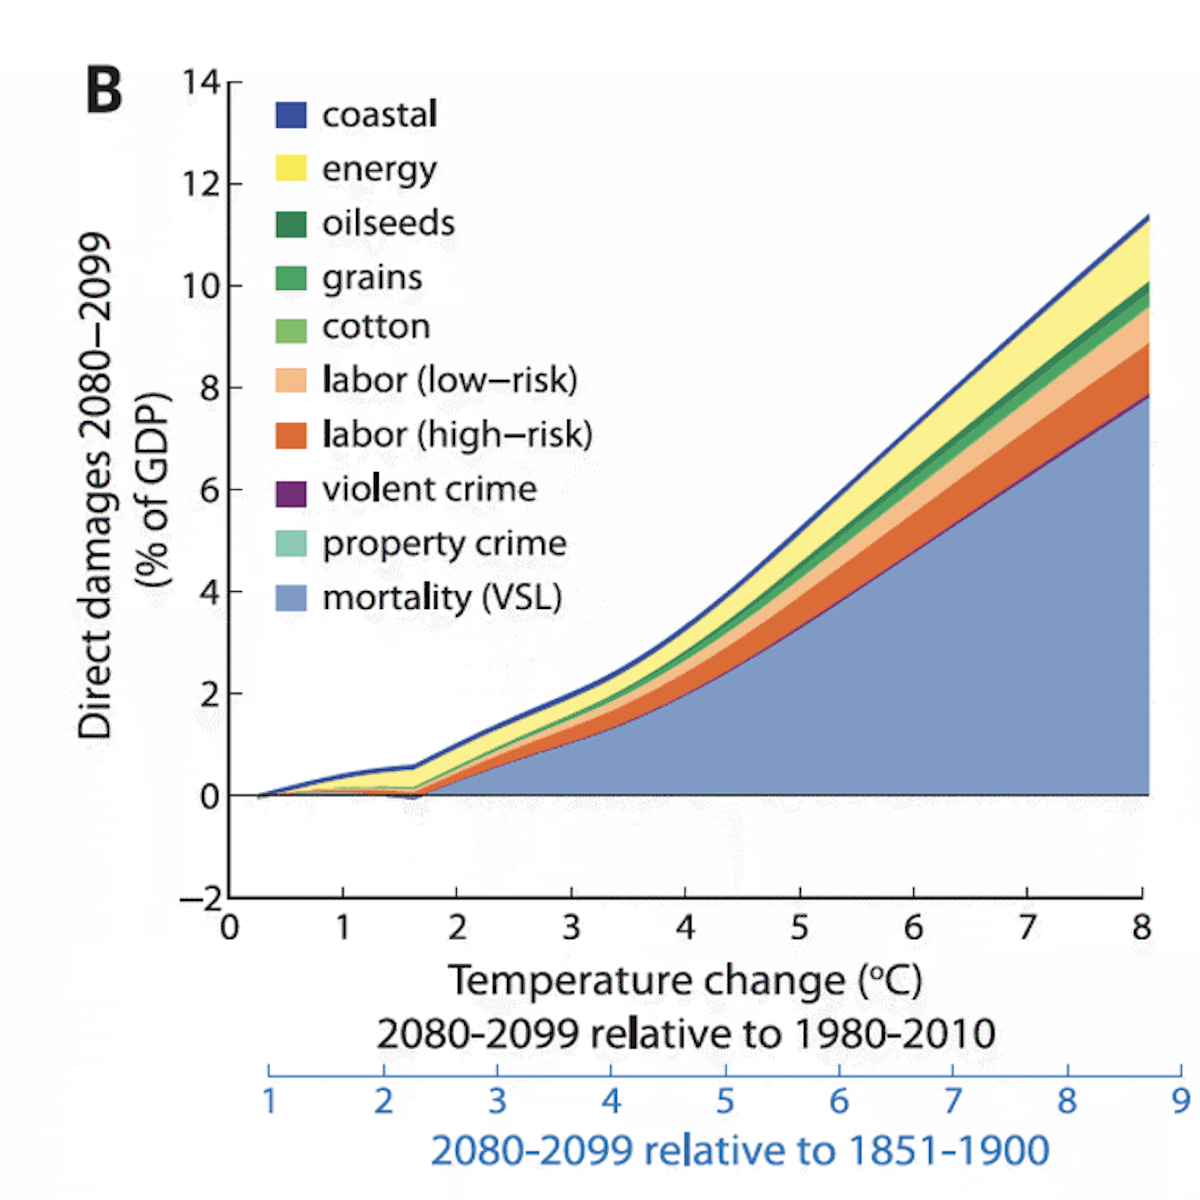
Given the large number of deaths affected by temperature, there is significant public and scientific interest in the impact of global warming on human mortality both in the current climate and going forward. This is especially the case given that projected increases in heat-related deaths are considered to be one of the most consequential impacts of climate change. For example, increases in heat-related deaths make up the majority of high-profile projections of monetary damages to the United States GDP after 2°C of warming (Fig. 1), and they are the largest component of the major global social cost of carbon estimates (Rennert et al., 2022).
Here we review the literature on deaths from non-optimal temperatures, how they have been changing, and how we expect them to change in the future. The following questions are addressed:
- How many people die of non-optimal temperatures in the current climate and are there more deaths associated with hot temperatures or cold temperatures?
- How does vulnerability to non-optimal temperatures vary across societies today?
- How have deaths related to non-optimal temperatures been changing historically?
- How are deaths related to non-optimal temperatures projected to change in the future?
How many people die of non-optimal temperatures in the current climate, and are there more deaths associated with hot temperatures or cold temperatures?
Few people die of hypothermia or heatstroke outright, but 1-10% of all human deaths are statistically associated with outdoor daily temperatures being away from human comfort levels (Burkart et al., 2021; Sera et al., 2019; Zhao et al., 2021). Typically, deaths associated with uncomfortable temperatures have a primary cause attributable to a chronic condition. The most common are cardiovascular or respiratory diseases, but others like diabetes, kidney disease, or tuberculosis are also exacerbated by temperatures (Burkart et al., 2021). Other common morbidities or situations associated with temperature-related deaths include self-harm, interpersonal violence, transport injuries, or unintentional injuries like drowning (Burkart et al., 2021; Madaniyazi et al., 2022). Thus non-optimal temperature is not the official cause of death in the vast majority of these cases but rather a contributing factor that can be ascertained only by investigating statistical relationships between daily temperature and death rates. Because temperature tends to have a much greater effect on death rates in populations with preexisting morbidities, it tends to have a much larger impact on the death rates of the elderly compared to other age groups (Carleton et al., 2022)(Fig. 14B).
Because of this disproportionate effect on the elderly, ambient temperatures can often be thought of as hastening a death that was very likely to occur in the coming weeks to years regardless of the temperature, a phenomenon known as “mortality displacement” or “harvesting.” This is evident statistically by noting that excess deaths after non-optimal temperatures are often followed by a period of below-normal deaths. Thus, many studies focus on life-years lost rather than deaths (Murray et al., 2020). However, for much of the temperature deaths discussed here, there is evidence that the amount of life lost due to non-optimal temperatures was at least a year (Armstrong et al., 2017).
The relationship between non-optimal temperatures and death rates is typically expressed with an exposure-repose function where ‘exposure’ refers to a population being exposed to a day at a given outdoor temperature, and ‘response’ is the elevated death rate. We will refer to these curves by the more descriptive “temperature-death risk relationship.”
Temperature-death risk relationships for 13 cities are shown in Fig. 2. The temperature-death risk relationships tend to be U-shaped or J-shaped where they reach a minimum at some optimal temperature (solid vertical black line), and the death rate increases as daily temperatures get significantly colder or warmer than the optimum. Death rates are typically expressed as the risk of death relative to the risk of death at the optimal temperature (labeled RR for Relative Risk). In Fig. 2, the frequency of days spent at various temperatures is also shown for each of the 13 cities (histograms below the temperature-death risk relationship). It can be seen that human societies spend a great deal of time in non-optimal temperatures, and most of that time is spent in colder than optimal temperatures as opposed to warmer than optimal temperatures (i.e., most of the histogram distributions are under the blue part of the temperature-death risk relationship as opposed to the red part).
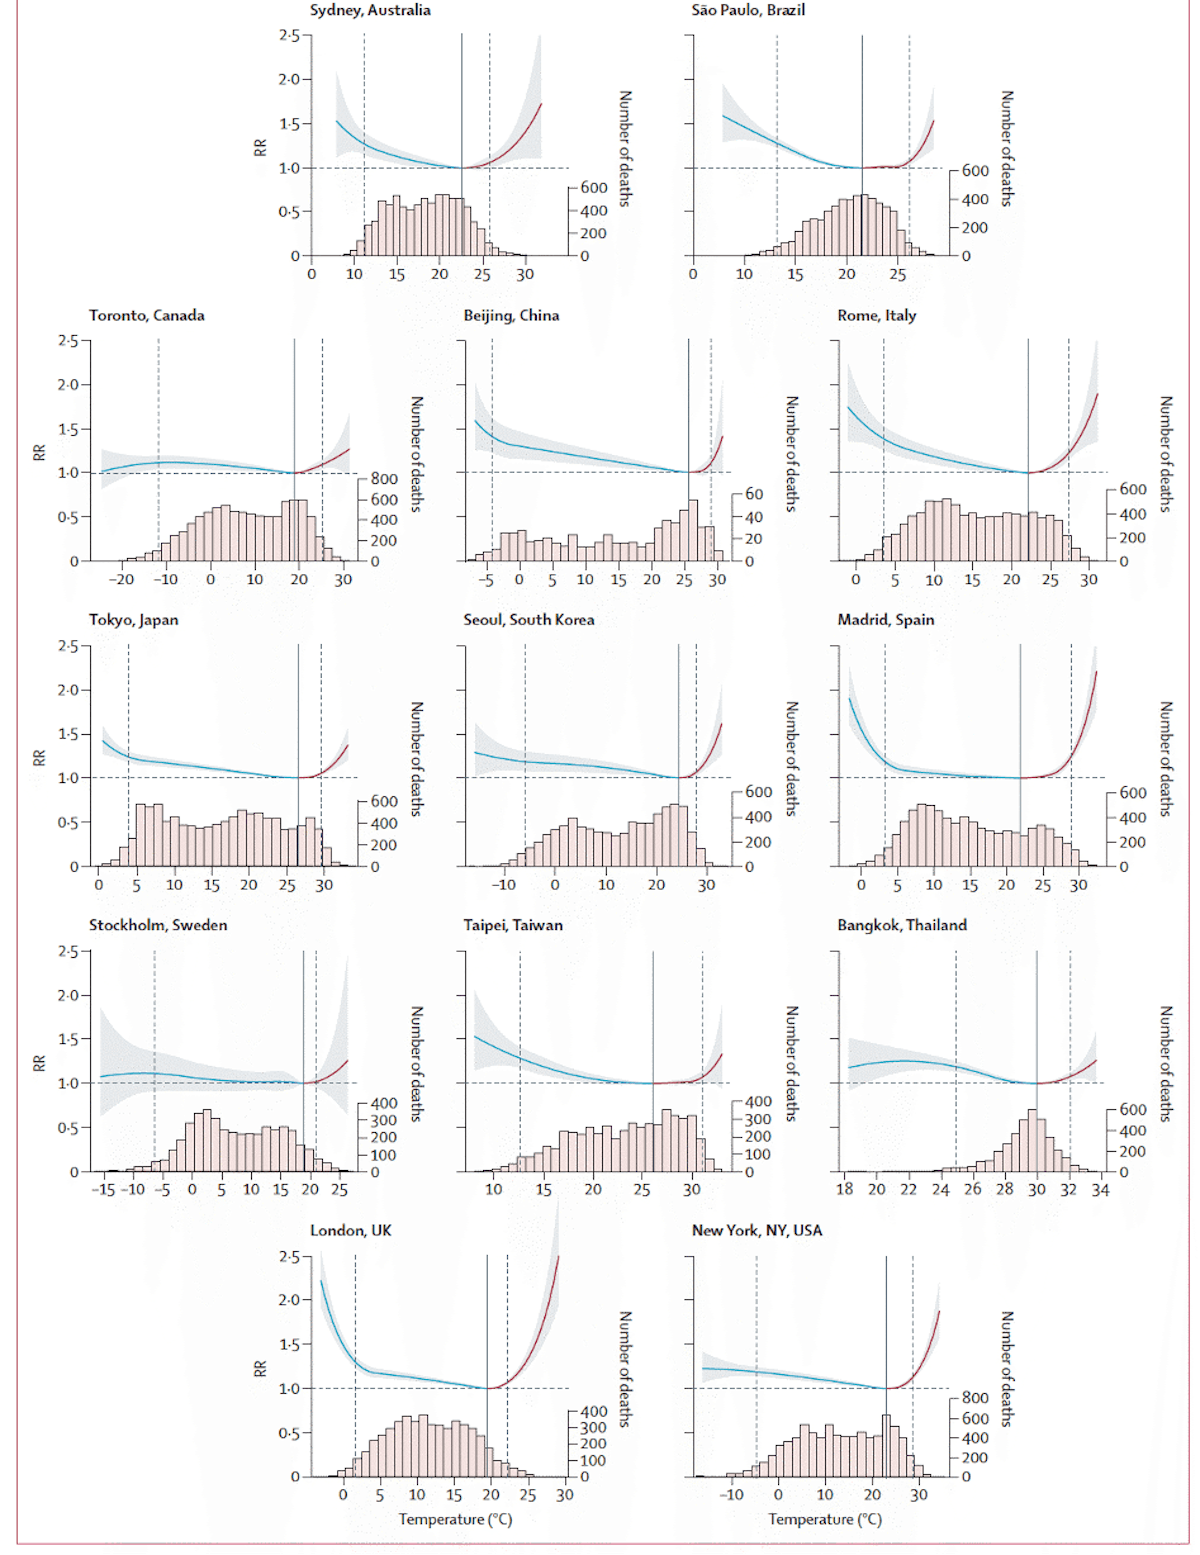
Most studies on the temperature-death risk relationship use unadjusted air temperature as opposed to wet-bulb temperature or indices that explicitly account for atmospheric humidity. However, since 24-hour mean temperature tends to be used rather than 24-hour maximum temperature, atmospheric humidity can be thought to be implicitly accounted for to some degree. This is because atmospheric daily low temperatures tend to be much higher when atmospheric humidity is high, so higher humidity days will raise daily low temperatures and thus be incorporated into the 24-hour mean temperature. Using a heat index or wet-bulb temperature should theoretically be a cleaner predictor of death rates from heat, but empirical investigations have not shown this to be the case (Armstrong et al., 2019).
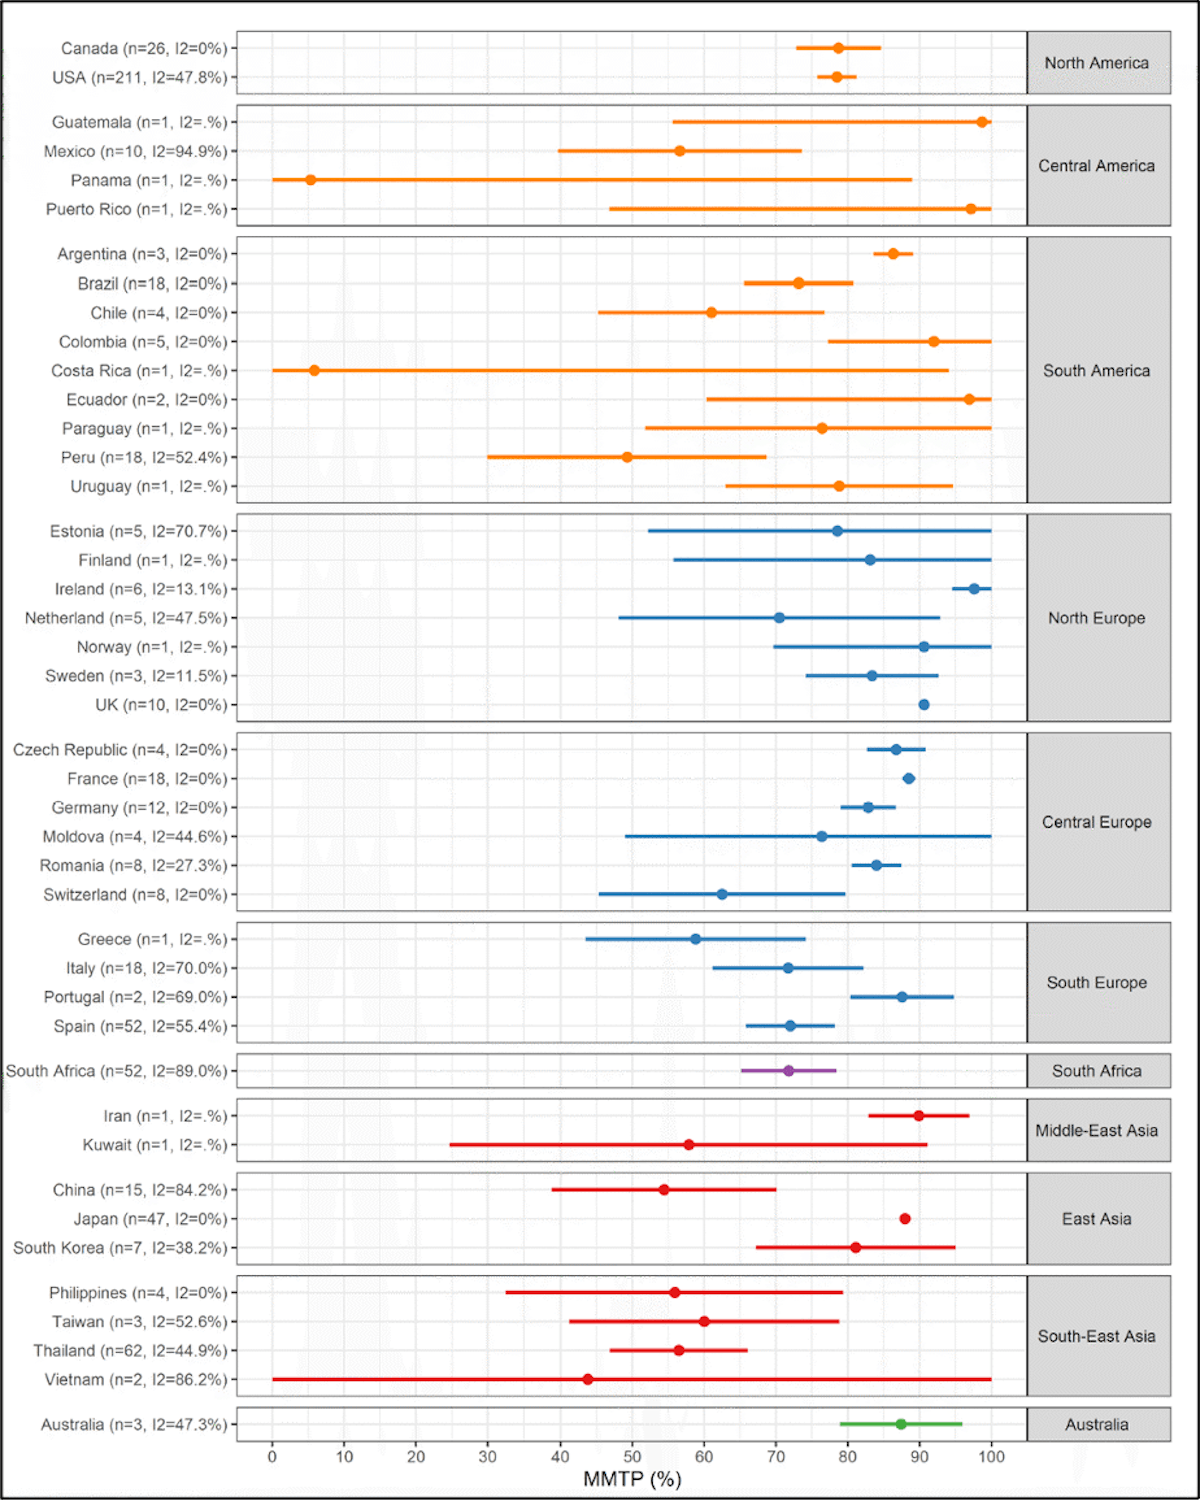
As suggested in Fig. 2, the majority of human settlements spend the majority of their time below the optimum temperature (Guo et al., 2014). This is illustrated in more detail in Fig. 3, which shows the percentile of the optimum temperature for 658 locations in 43 countries. A percentile of 70, for example, would mean that at that location, 70% of the time is spent at temperatures cooler than the optimum, while 30% of the time is spent at temperatures warmer than the optimum. 39 out of 43 countries in this study (Tobías et al., 2021) had mean optimum temperature percentiles above 50%.
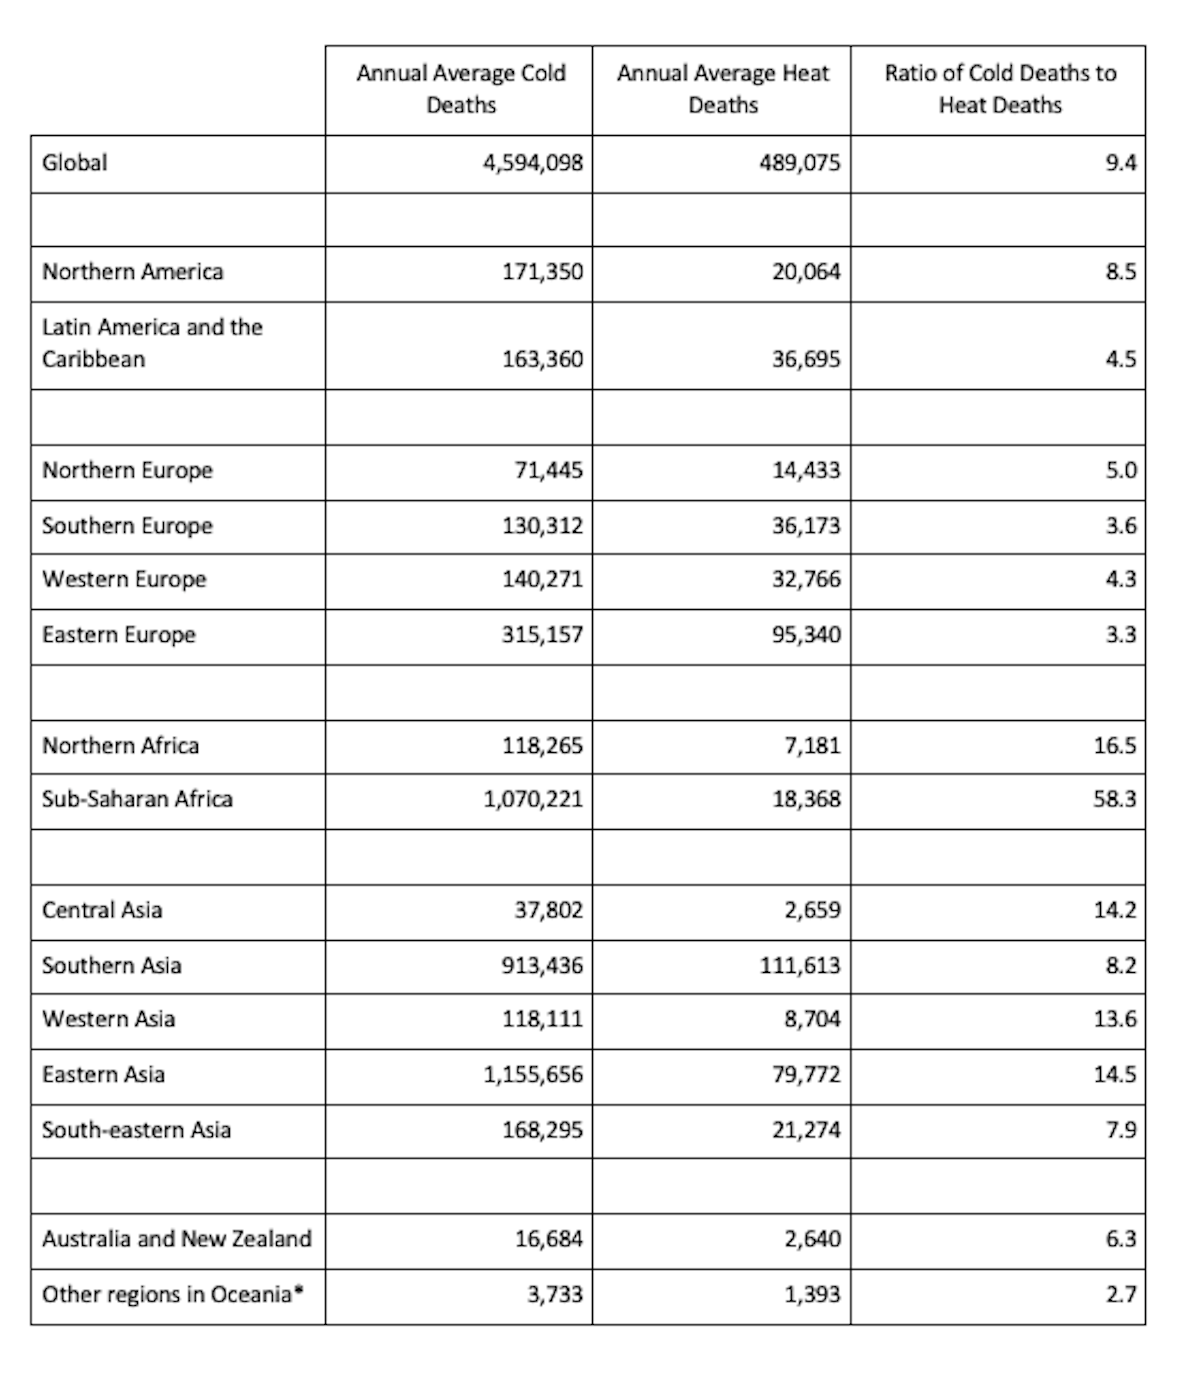
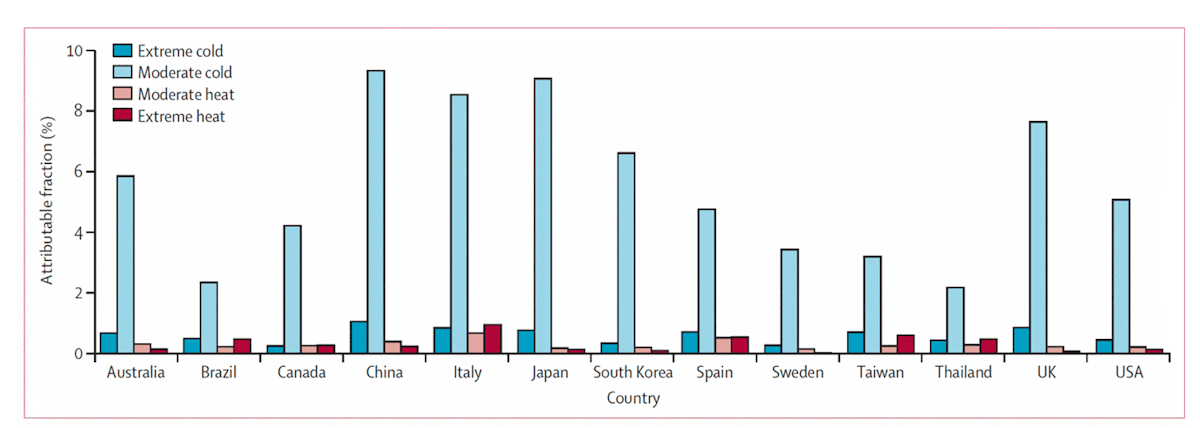
Given that human settlements tend to spend more time on the cold side of the optimum than they do on the warm side of the optimum, it is not surprising that, in the current climate, deaths associated with cold outnumber deaths associated with heat by factors of 5 to 10 globally (Table 1) (Burkart et al., 2021; Gasparrini et al., 2017; Sera et al., 2019; Zhao et al., 2021). This is illustrated in Fig. 4, which shows the fraction of all deaths attributable to non-optimal temperatures of various severities in 13 countries (moderate temperatures are those within the local 2.5-97.5 percentiles, while extremes are below the local 2.5 percentile or above the local 97.5 percentile). Spending time in the moderate cold category accounts for the most deaths, not because it is more dangerous than extreme cold or extreme heat but because moderate cold is experienced at a much greater frequency. This is the case even in tropical countries like Brazil and Thailand.
Table 1 | Estimates of annual average cold-related and heat-related deaths from 2000 to 2019 in different regions of the world. Adapted From Zhao et al. (2021).
How does vulnerability to non-optimal temperatures vary across societies today?
A close inspection of Fig 2 above reveals that the optimum temperature (the temperature that minimizes death rates) varies significantly from place to place. Figure 5 shows this in more detail, comparing Winnipeg, Canada, and Tucson, Arizona. In Winnipeg, Canada, an outdoor daily mean temperature (24-hour average) of 29°C (84°F) would be very unusual (as indicated by the histogram), and it is associated with a substantially elevated death rate (even more elevated than the death rate at -30°C (-22°F)). But this same daily mean temperature of 29°C is actually the optimum temperature in Tucson, Arizona.
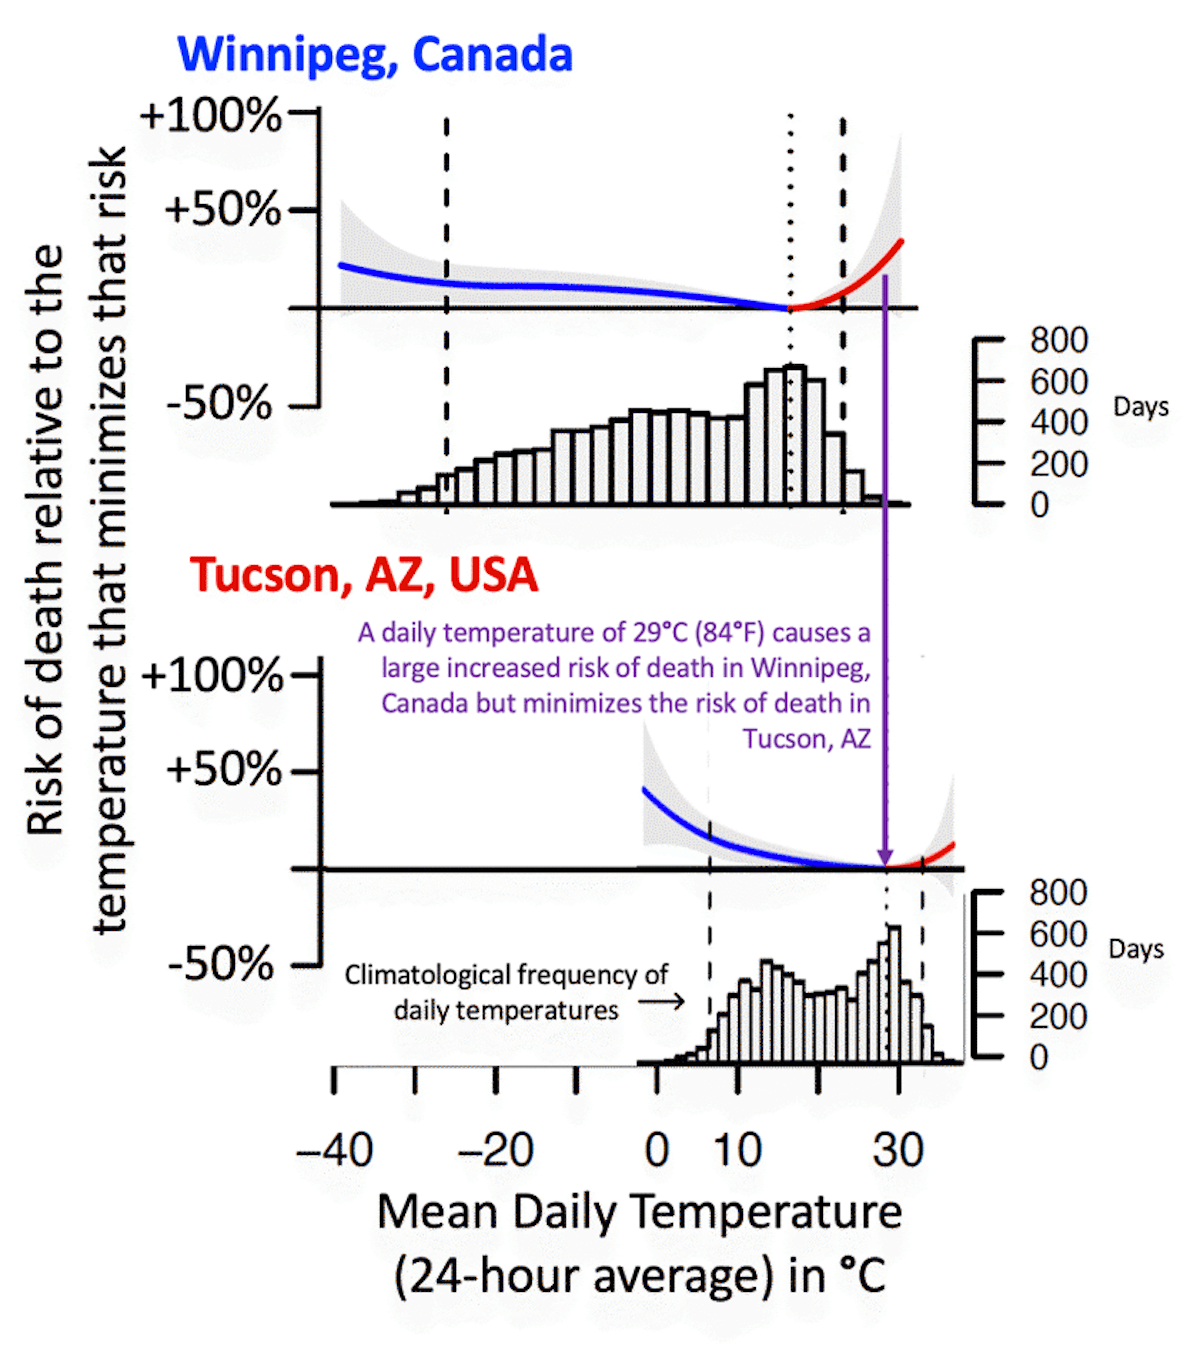
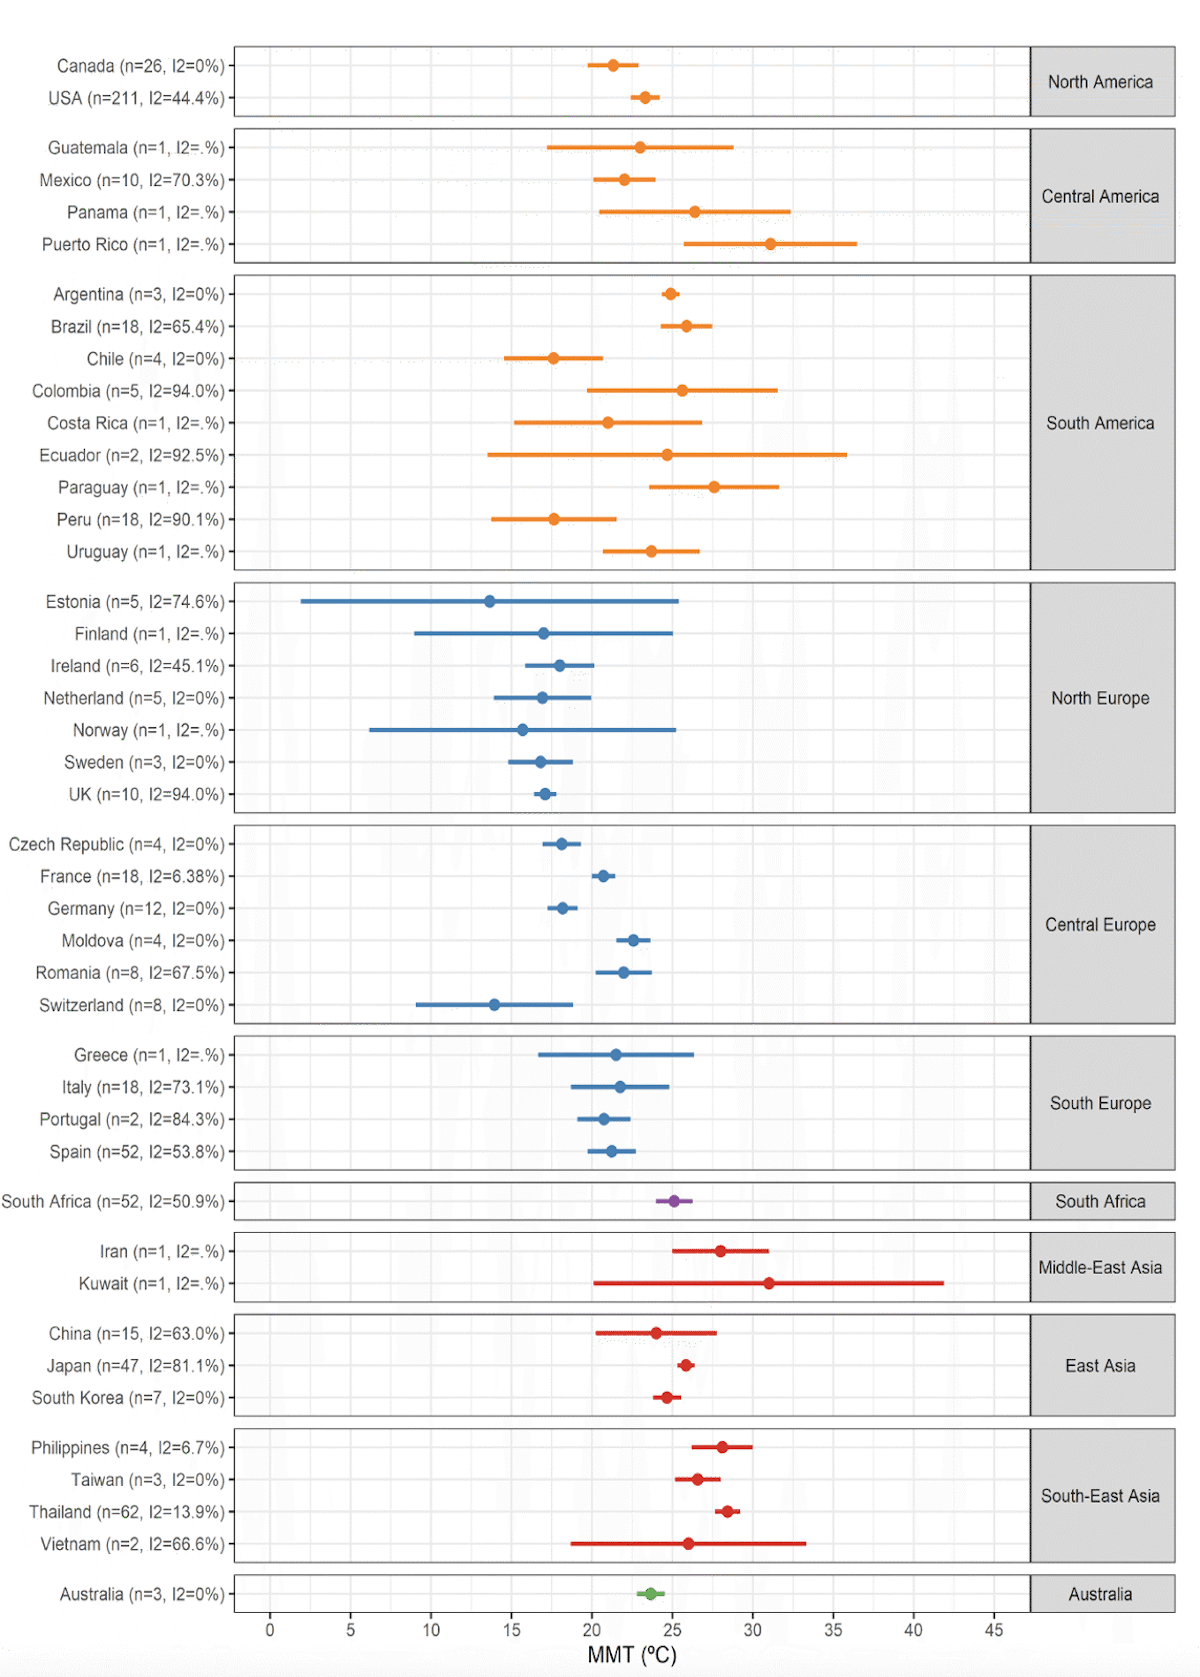
This is an illustration of there being substantial acclimation to local temperatures across geographies in the present world. This is the case more generally, as optimal temperatures vary substantially from place to place (Carson et al., 2006; Tobías et al., 2021; Watts et al., 2015; Yang et al., 2015; Yin et al., 2019) (Fig. 6 and Fig. 7). The span in optimal temperatures was found to range from a value of 12°C (54°F) to 30°C (86°F), a range of 18°C, in an analysis of 420 cities (Yin et al., 2019).
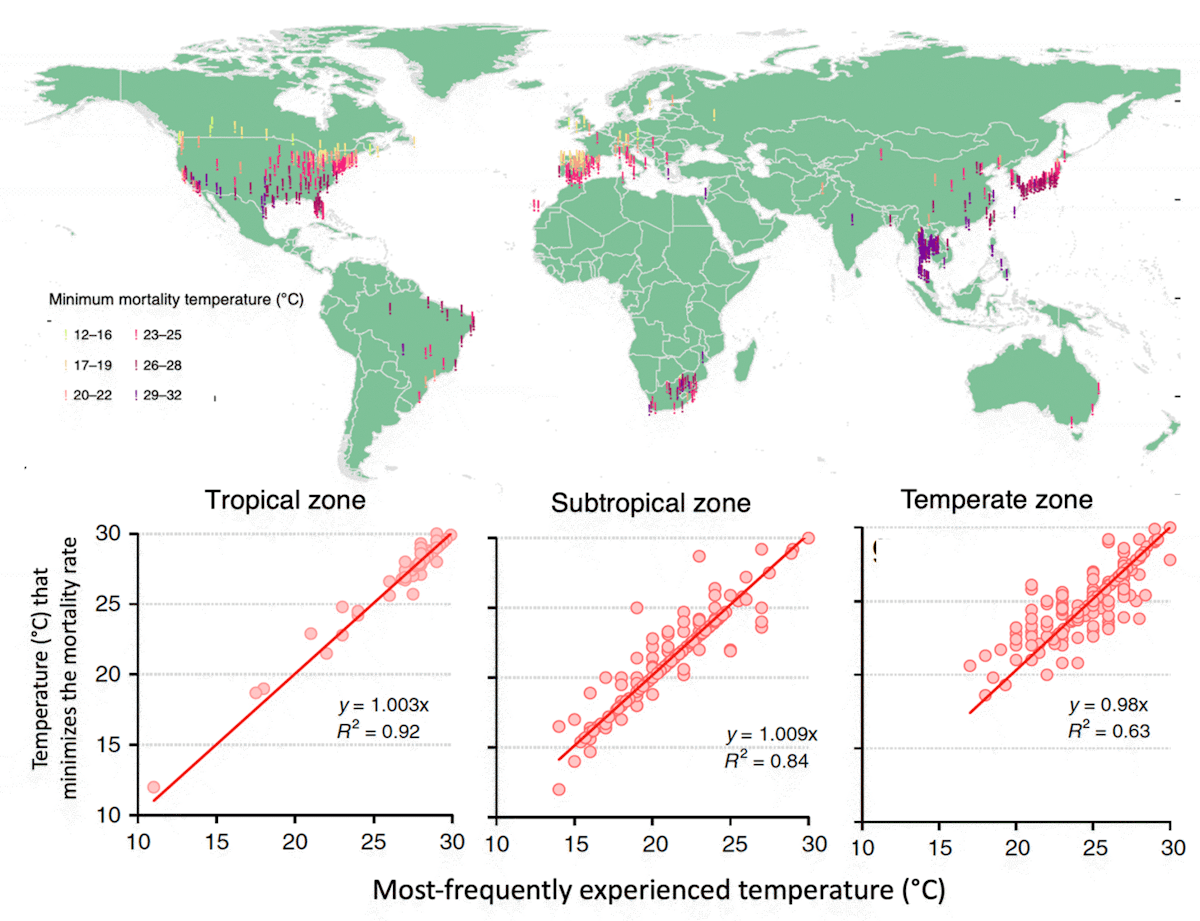
Not surprisingly, climatologically warmer locations tend to have a warmer optimum temperature than cold locations (Burkart et al., 2021; Carleton et al., 2022; Leone et al., 2013; Tobías et al., 2021; Zhao et al., 2021). Yin et al. (2019) found that across societies today, the optimum temperature increases in lockstep with the most frequently experienced temperature (Executive Summary Fig. 1 and Fig. 7), indicating very high acclimation across at least 18°C in the current climate.
A large part of this acclimation can be explained by heating and cooling technologies having larger adoption in locations that routinely experience cold and hot temperatures, respectively. There are also presumably other behavioral, technological, informational, economic, and infrastructural pathways toward acclimation that should be major research priorities going forward.
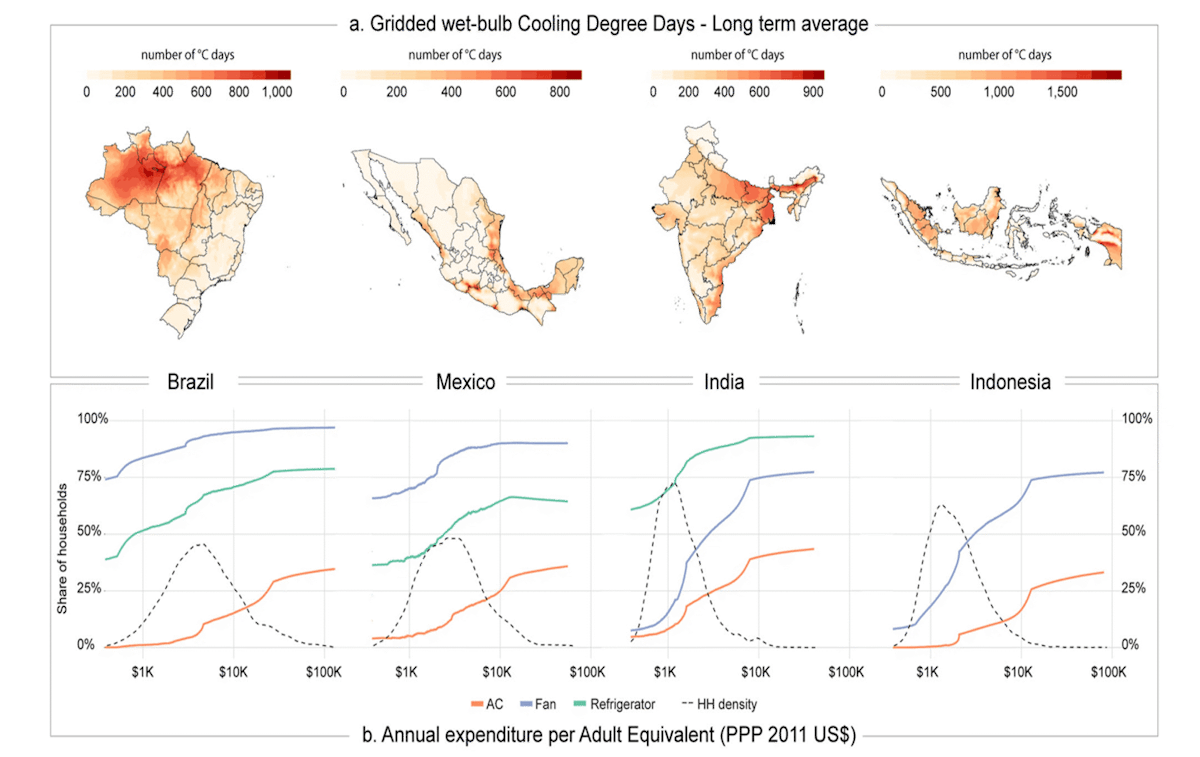
Most pathways to acclimation are facilitated by higher incomes which are associated with decreased sensitivity to non-optimal temperatures (Bressler et al., 2021; Carleton et al., 2022) (Zhao et al., 2021). For example, higher incomes are associated with greater access to and adoption of air conditioning (Fig. 7)(Barreca et al., 2016; Pavanello et al., 2021). Additionally, higher incomes can reduce sensitivity to non-optimal temperatures via their association with other factors like smaller rates of outdoor occupations, less physical labor as a share of total labor, and greater access to healthcare (Sera et al., 2019; Sera et al., 2020).
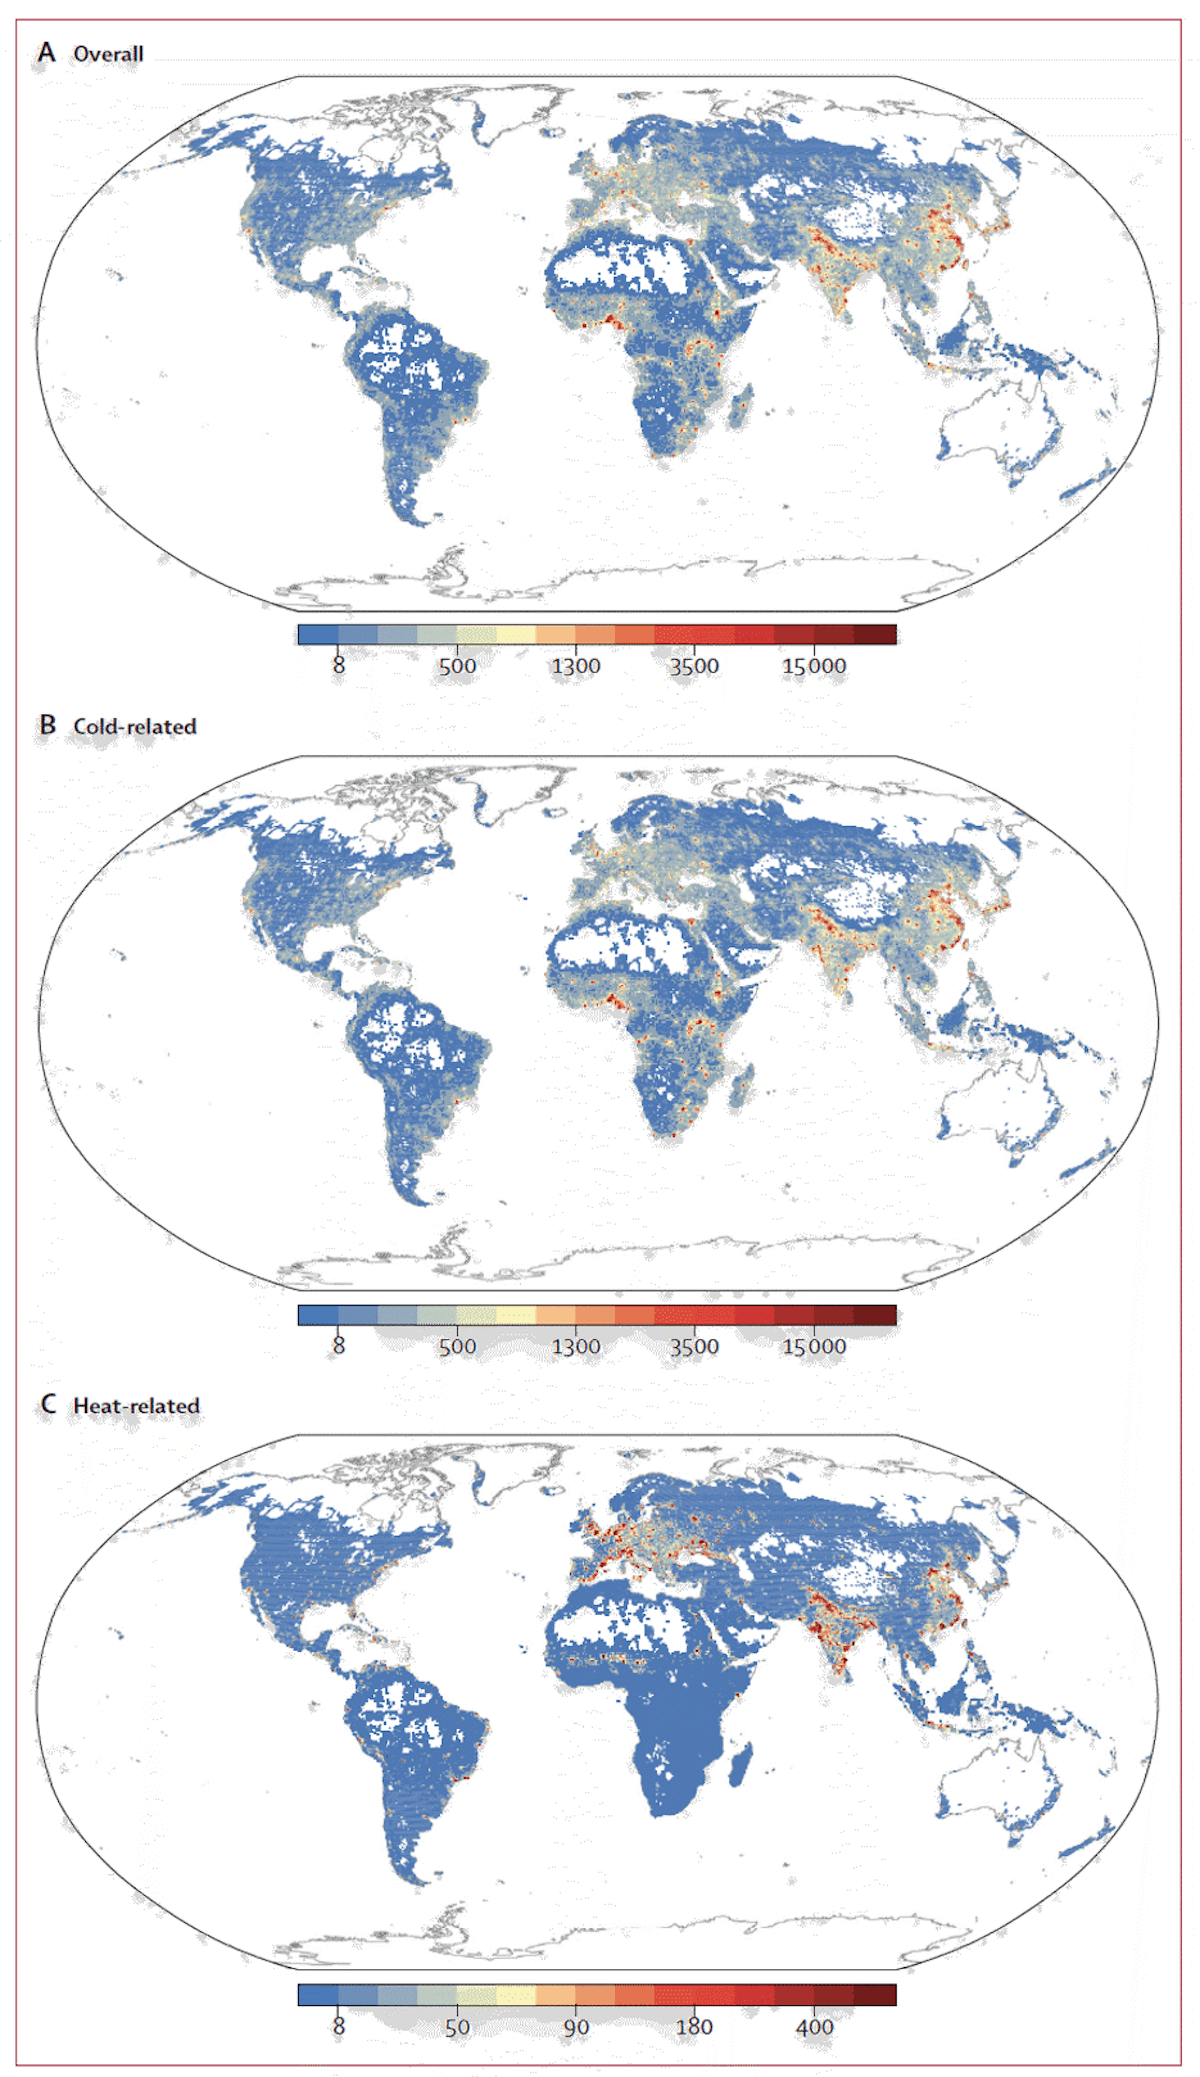
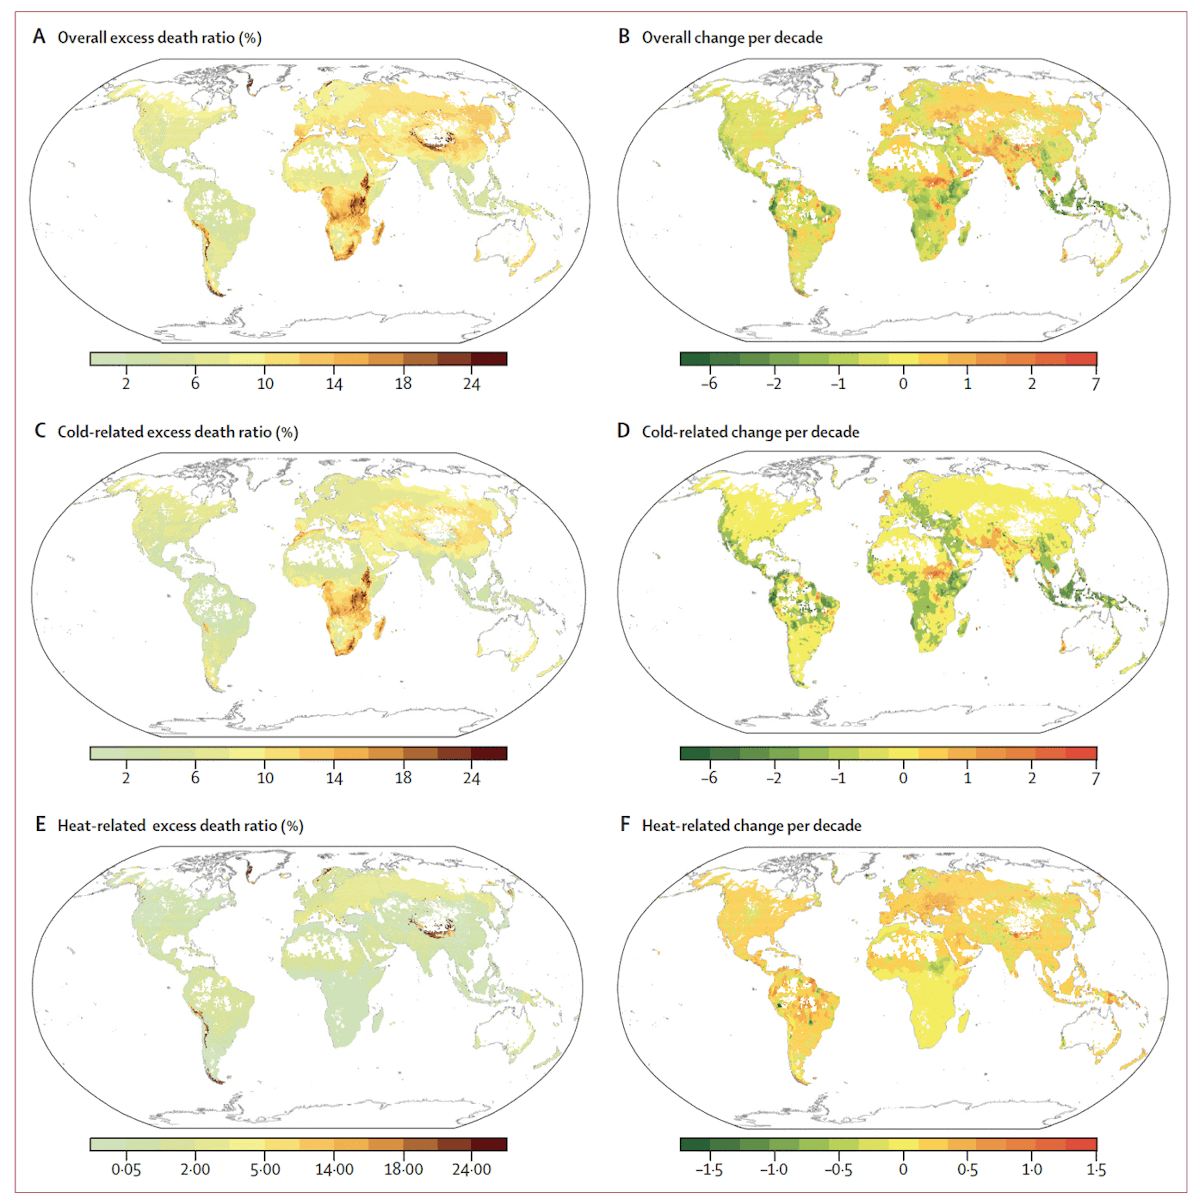
This acclimation to local climate means that hotter places do not see substantially more heat-related deaths than milder places, nor do colder places see more cold-related deaths. For example, the statistical model developed in Zhao et al. (2021) indicates more cold-related deaths in Nigeria than over the east coast of the United States (Fig. 9b) and more heat-related deaths in Europe than in Indonesia (Fig. 9c).
In addition to air conditioning, the local arrangement of urban areas can have a large impact on ambient temperature and, thus, human health. Large, dense urban areas can be, on average, as much as 10°C warmer than surrounding rural areas due to urban structures’ absorption and re-radiation of solar energy as well as anthropogenic heat sources—a phenomenon known as the urban heat island effect (Rizwan et al., 2008). This means that urban planning has the potential to affect the ambient temperature within cities substantially and, thus, the temperatures actually experienced by people. For example, Medellín Columbia implemented a program that created a network of corridors of greenery over three years and reported a 2°C reduction in urban temperatures (for context, that area of the world has warmed approximately 1°C since the industrial revolution).
How have deaths related to non-optimal temperatures been changing historically?
As temperatures warm, a baseline expectation would be that the deaths from cold decrease and deaths from heat increase. In many locations, the relationship between temperatures and risk of death is steeper on the warm side of the optimal temperature than on the cold side (referred to as J-shaped exposure-response functions), so it can be the case that warming would increase heat-related deaths more than it would decrease cold-related deaths even as cold deaths remain higher than heat deaths. An example of this is shown in Fig 10, in which the projected warming of the temperature distribution in London results in a decrease in cold-related deaths but a larger increase in heat-related deaths. After warming, cold-related deaths remain larger than heat-related deaths, but there is a slight increase in net deaths (see also Figs 21 and 22 below).
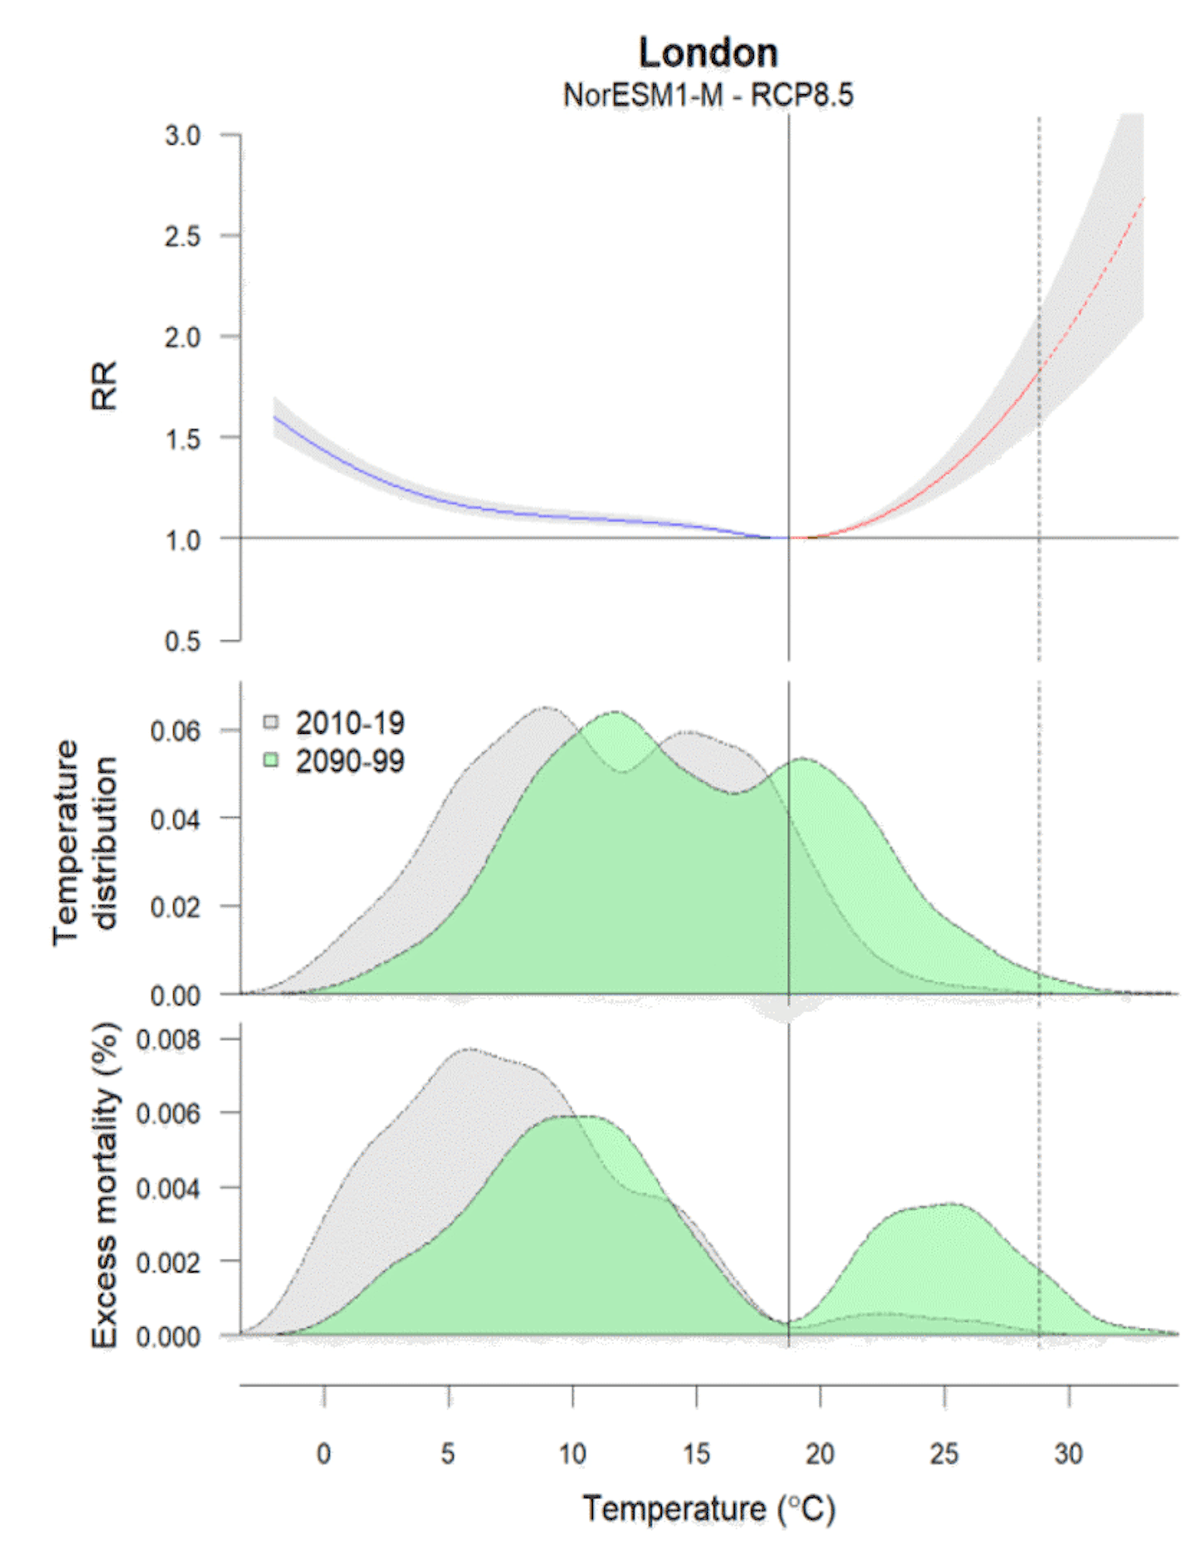
However, the illustration in Fig. 10 shows the effect of temperature change alone: The temperature distribution shifts under a temperature-death risk relationship that is held constant. In reality, changes in deaths will depend both on how the temperature distribution shifts and on how the optimum temperature and the shape of the temperature-death risk relationship changes over time (Folkerts et al., 2020).
Since temperature-death risk relationships vary so significantly across space both in terms of optimum temperature and shape of the curve, it is not credible to assume that they would remain constant over time going forward.
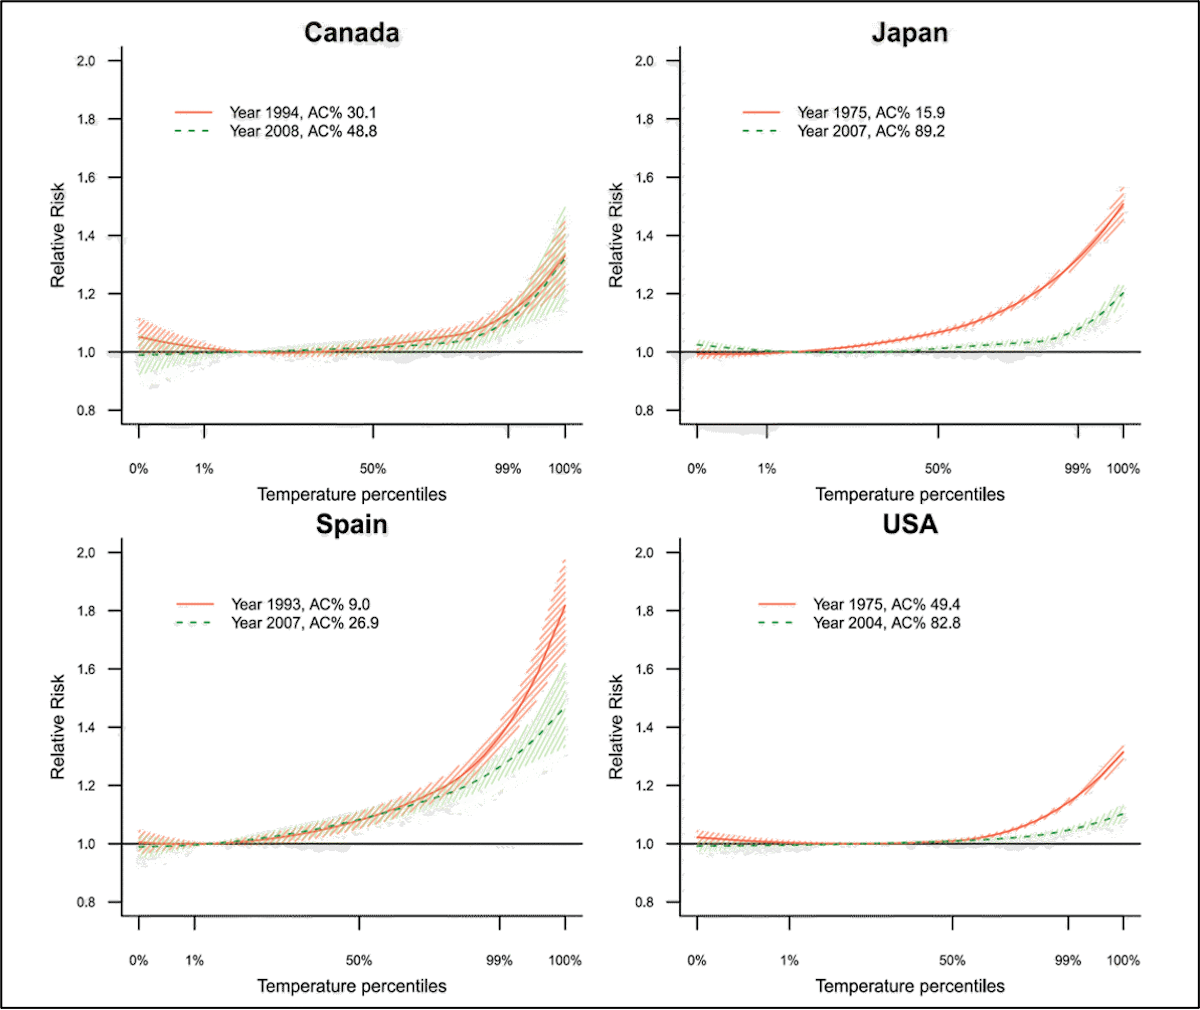
Indeed, studies have shown that temperature-death risk relationships are changing over time, and in most places, they are changing in a way that reduces the risk of death at most temperatures (e.g., flattening) (Fig. 11).
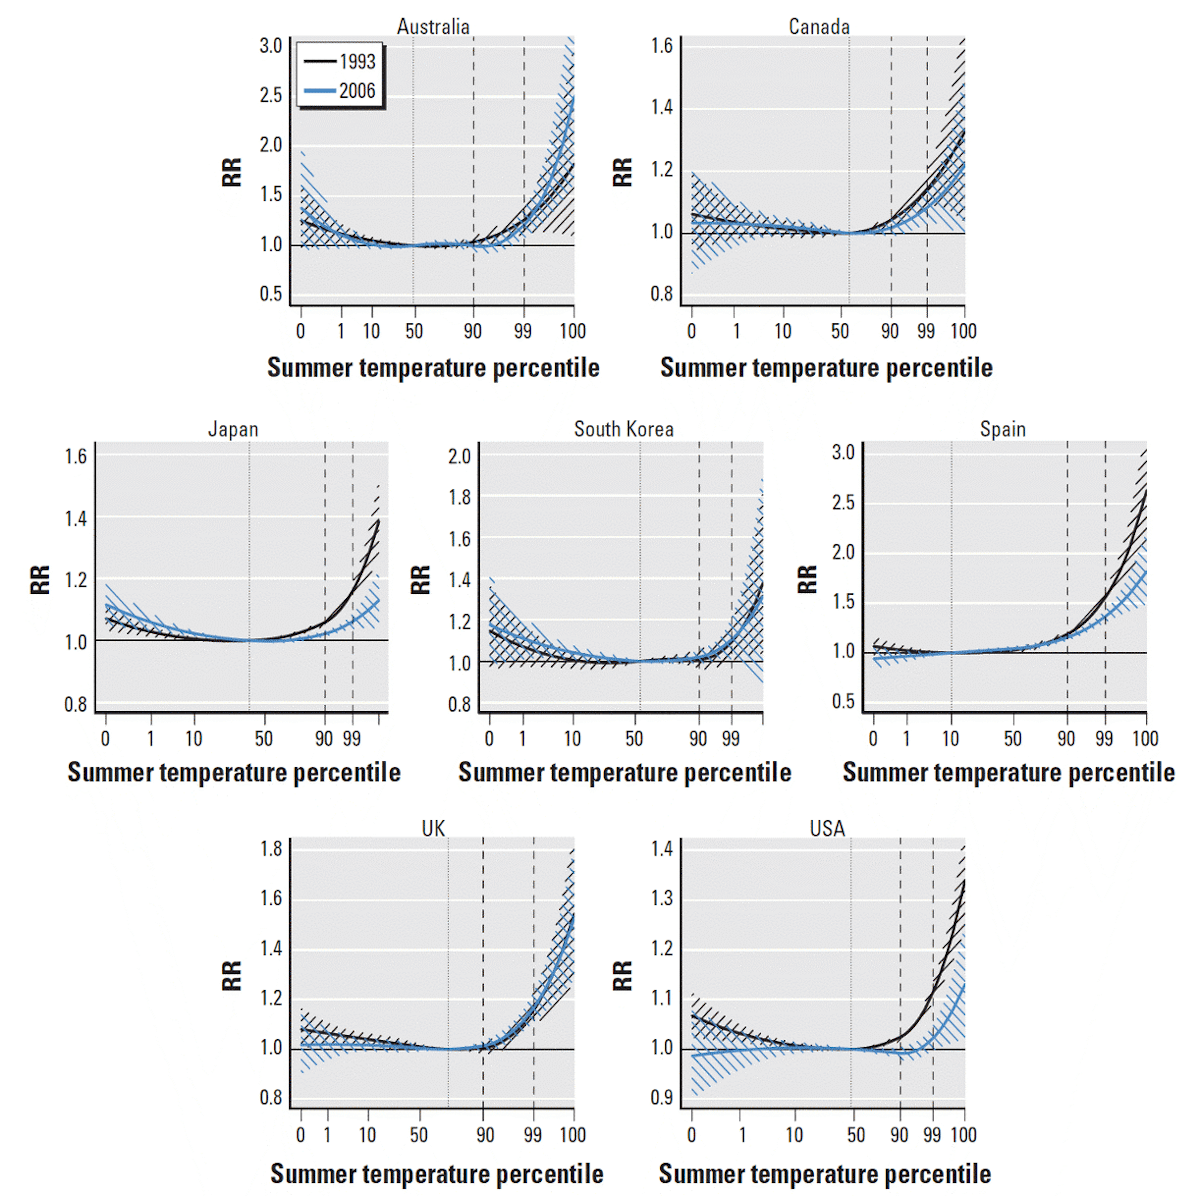
This flattening, indicating an increase in resilience to non-optimal temperatures, means that even in isolation, deaths associated with heat can decrease over time despite warming.
The phenomena of declining heat deaths despite warming has been found in most locations studied (Arbuthnott et al., 2016; Gasparrini et al., 2015a; Kinney, 2018; Sheridan and Allen, 2018; Vicedo-Cabrera et al., 2018). Decreasing heat deaths over time have been observed in The United States (Barreca et al., 2016; Bobb et al., 2014; Davis et al., 2003; Nordio et al., 2015; Sera et al., 2020; Sheridan et al., 2009), Japan (Ng et al., 2016; Sera et al., 2020), Australia (Coates et al., 2014), Czech Republic (Kyselý and Plavcová, 2012), the UK (Carson et al., 2006; Christidis et al., 2010), Spain (Martínez-Solanas and Basagaña, 2019; Sera et al., 2020), Sweden (Åström et al., 2013), Austria (Matzarakis et al., 2011).
This phenomenon is described below by the IPCC AR6 Working Group 2 (Chapter 16.2.3.5):
“Heat-attributable mortality fractions have declined over time in most countries owing to general improvements in health care systems, increasing prevalence of residential air conditioning, and behavioral changes. These factors, which determine the susceptibility of the population to heat, have predominated over the influence of temperature change.”
Examples of declining sensitivity to heat with time are shown for discrete regions in the United States (Fig. 12) groups in the United States (Fig. 13) and discrete groups in Japan (Fig. 14) below.
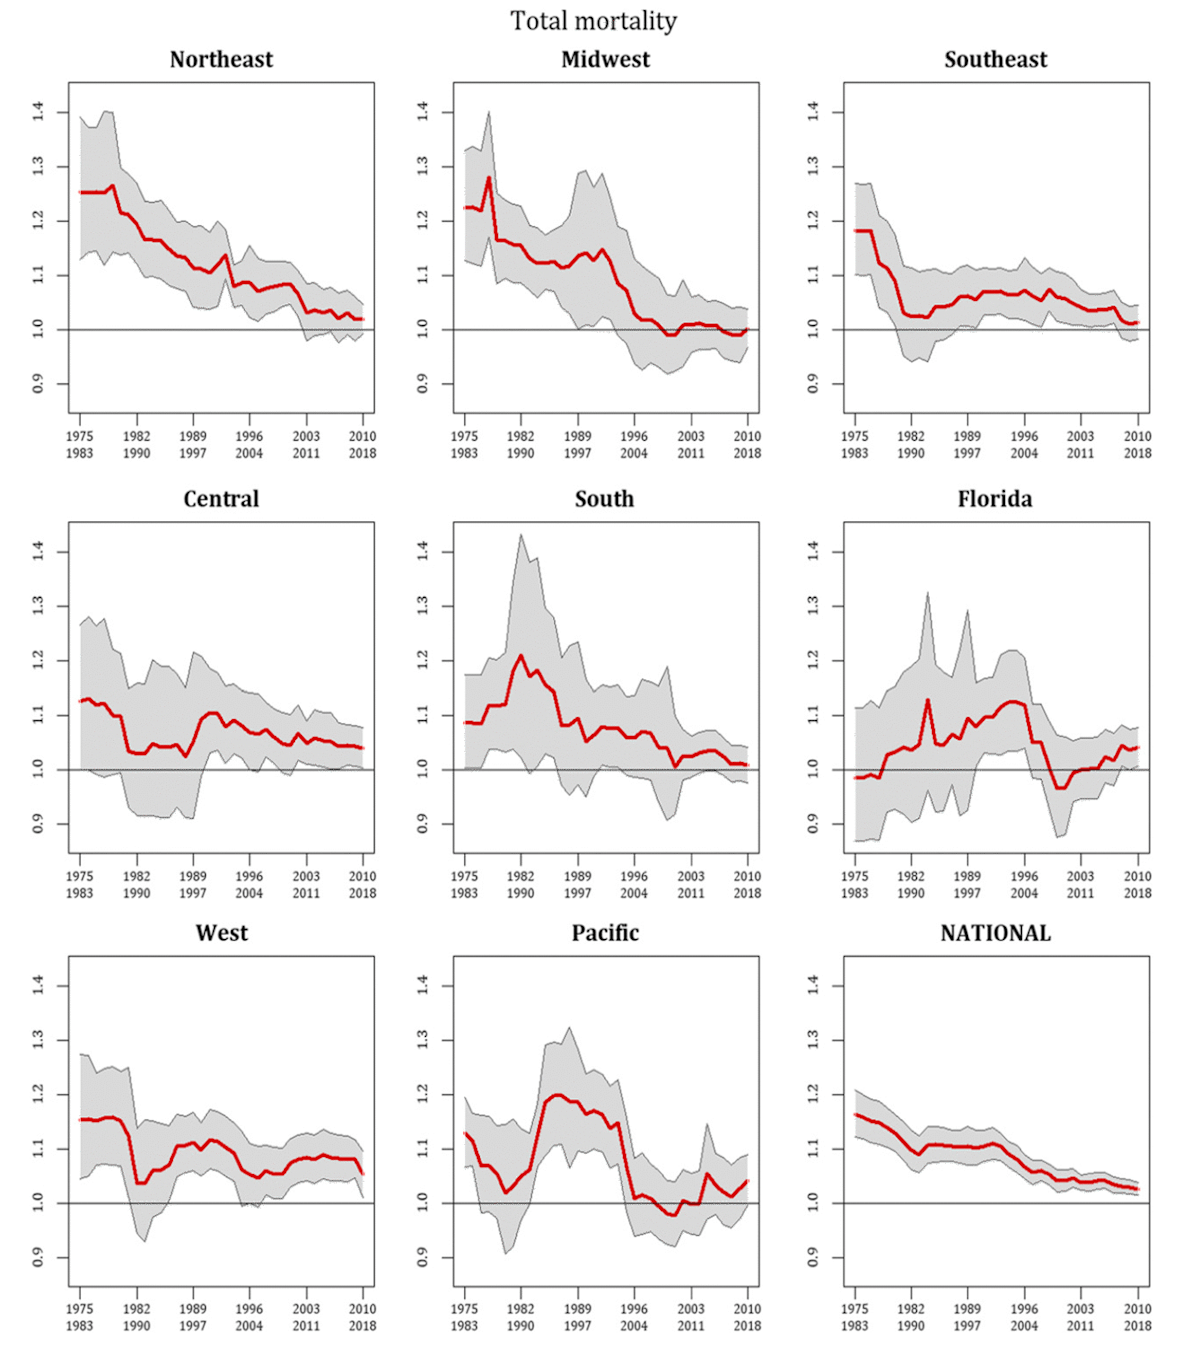
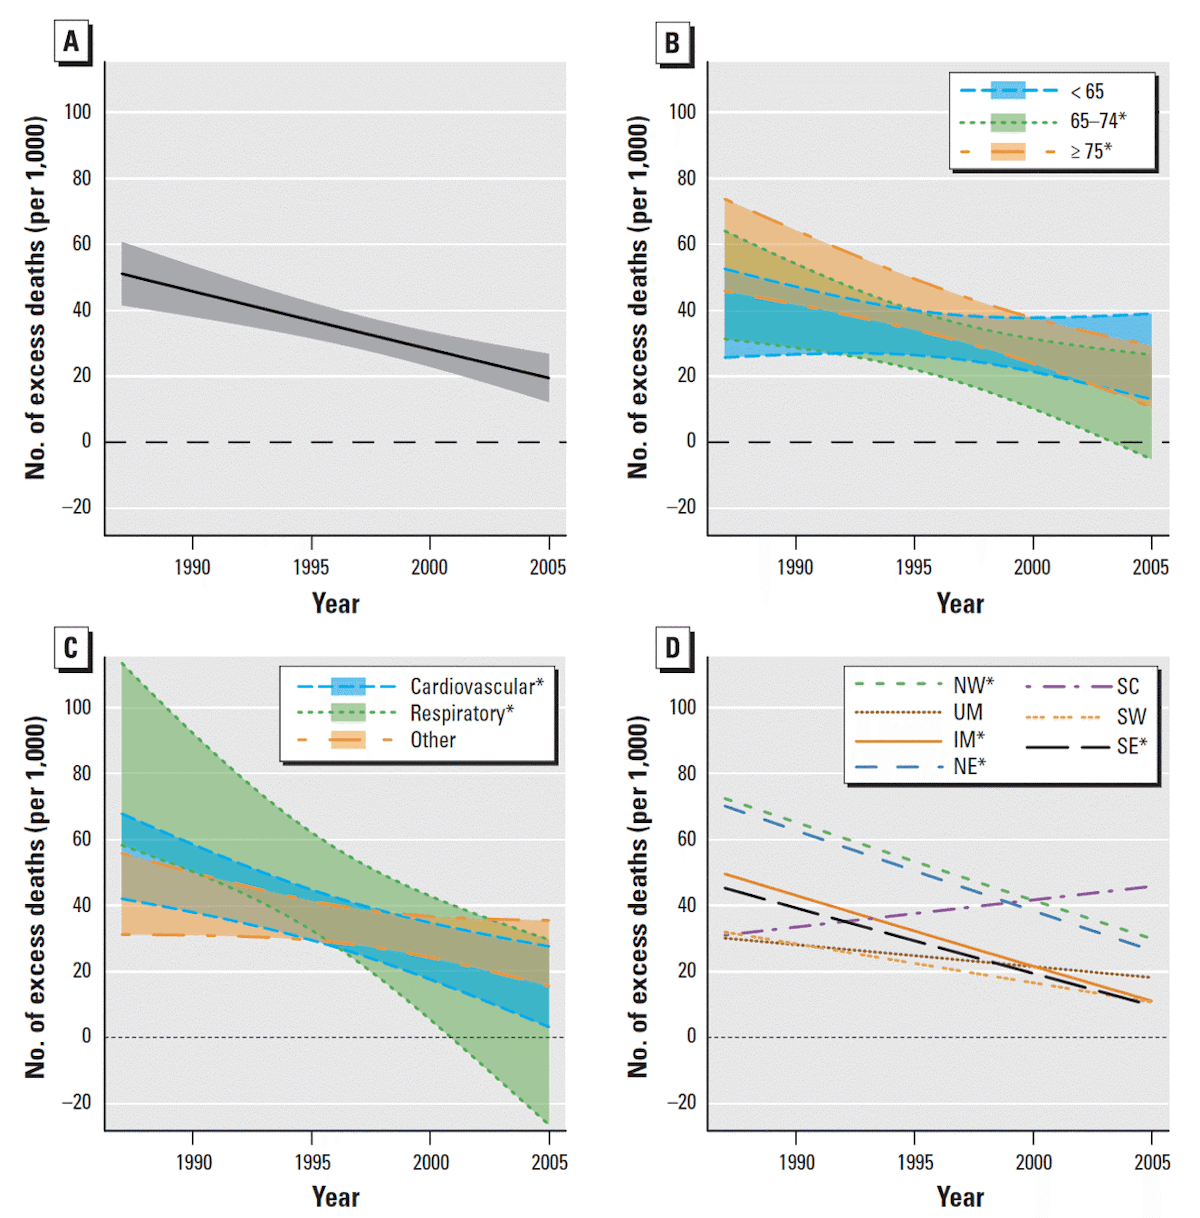
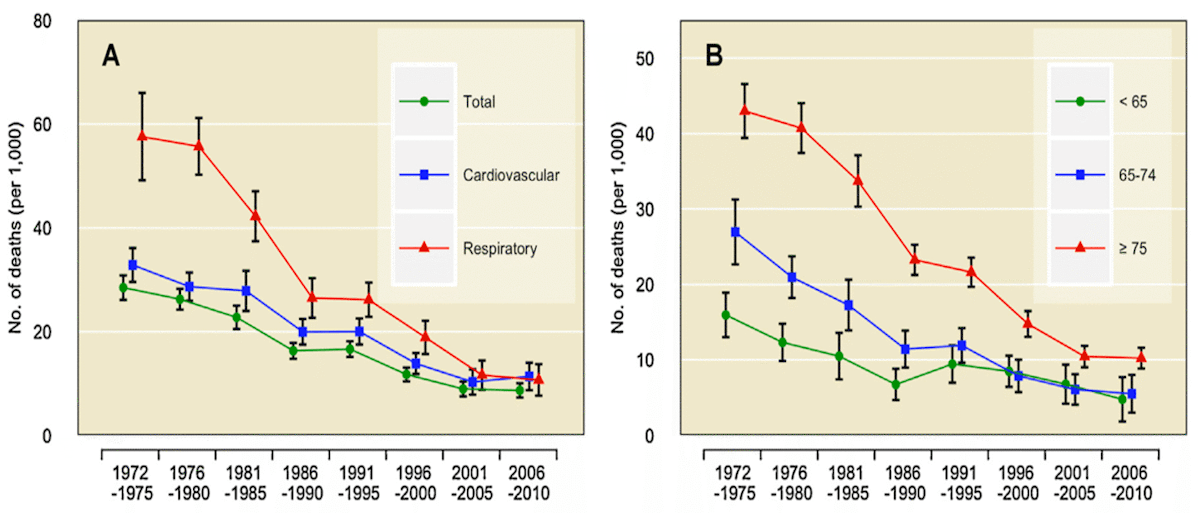
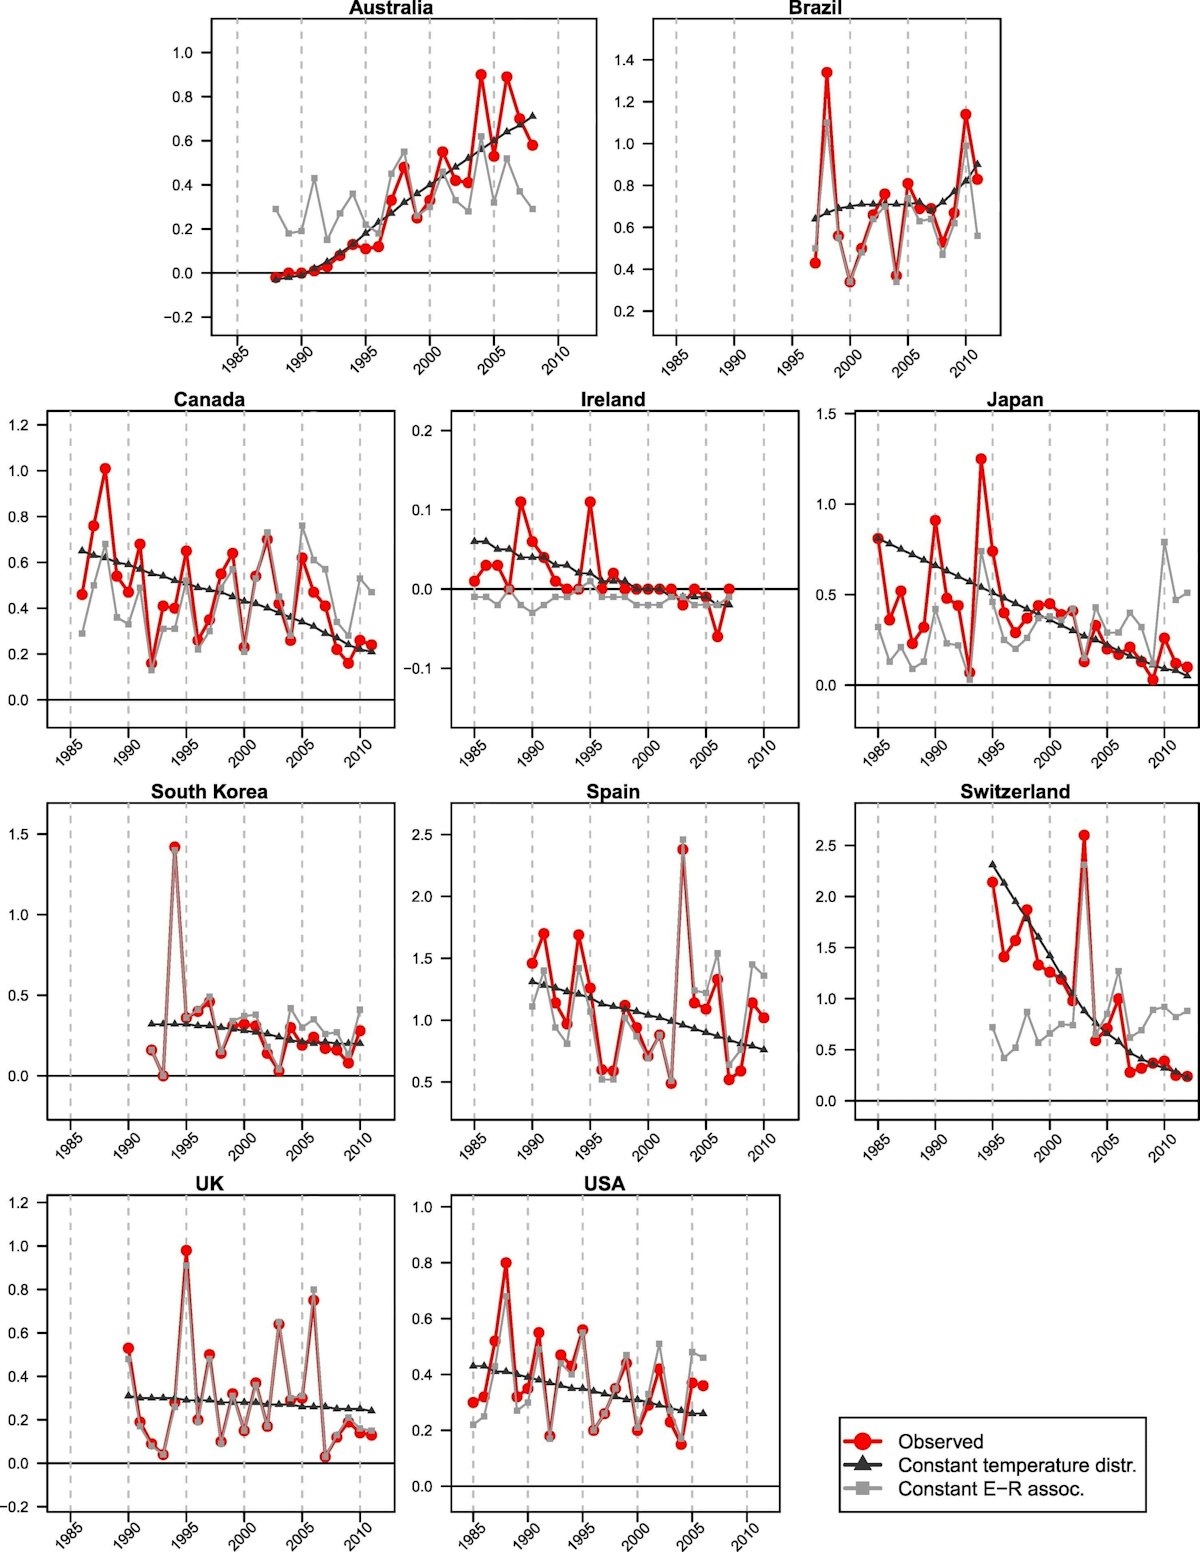
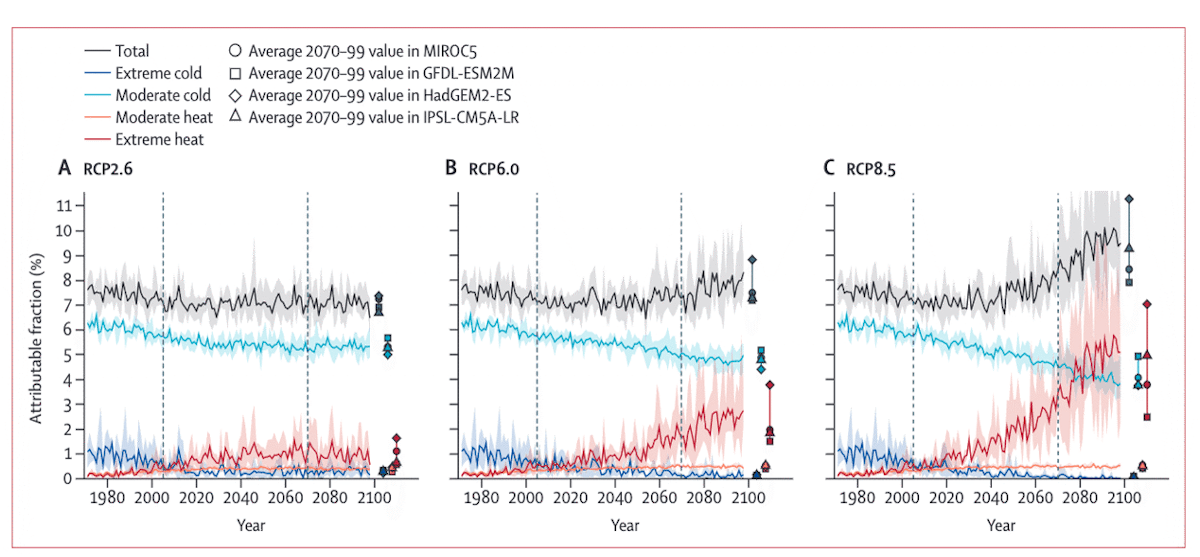
Figure 15 shows trends in heat-related deaths in 10 countries. The fraction of deaths attributable to hot temperatures are shown in red, and the amount of variation attributable to a change in the temperature-death risk relationship is in black. In 8 out of 10 countries investigated in that study (Vicedo-Cabrera et al., 2018), the fraction of deaths attributable to heat declined over time, and this decline was due mostly to decreased sensitivity to heat (i.e., not local cooling).
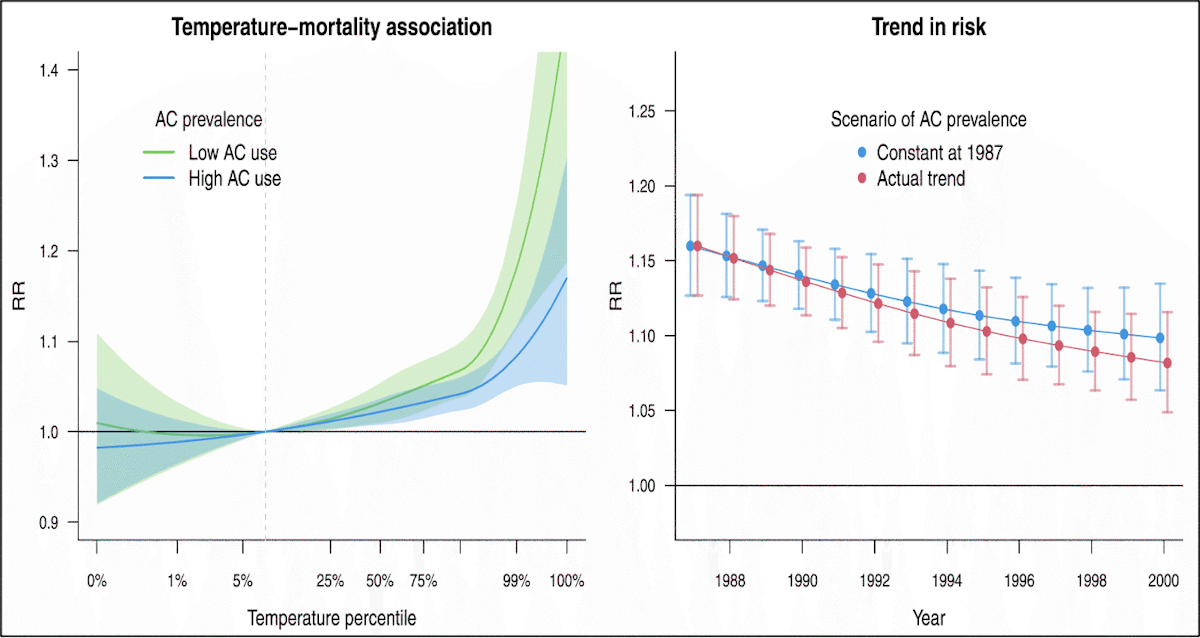
Increased air conditioning adoption over time has boosted resiliency and aided the decline in heat deaths over time in many countries (Fig. 16).
However, air conditioning adoption rates, while impactful, cannot account for all (or even most) of the reduced sensitivity to hot temperatures observed over time in many locations (Fig. 17).
Other factors associated with technological and societal change must account for the remaining decline in sensitivity, and this is a very active area of investigation. Overall, the decline in heat-related deaths should not be thought of as simply adaptation to climate change (which would lag behind and only attenuate the impact of climate change). Rather it is increased societal resilience to natural hazards—resilience that is outpacing the impact of climate change:
“Our findings suggest a decrease in heat-mortality impacts of the past decades well beyond those expected from a pure adaptation to changes in temperature due to the observed warming” (Vicedo-Cabrera et al., 2018).
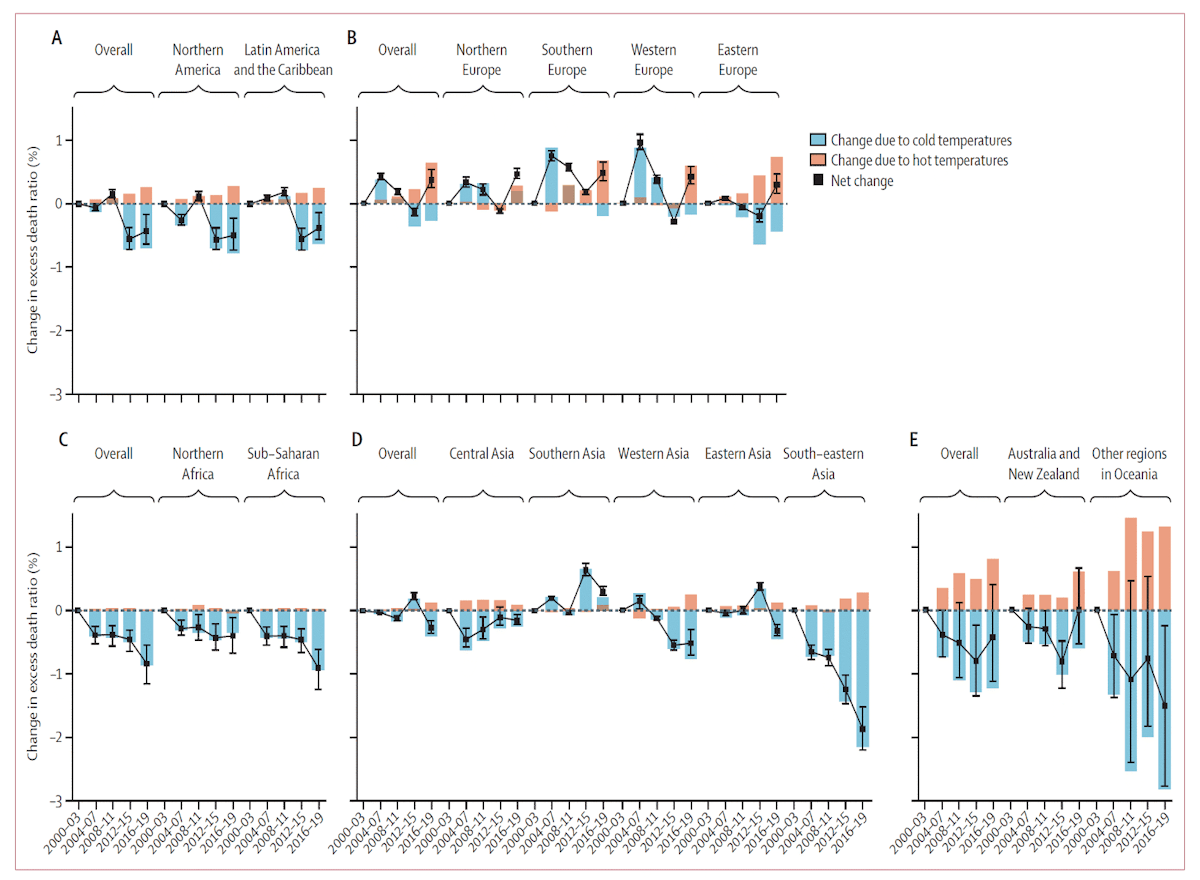
Cold deaths have also been found to be decreasing due to increased resilience, but their decrease is aided by warming temperatures in most locations. Thus, total deaths from non-optimal temperatures have been found to be decreasing in most locations (Fig. 18 and Fig. 19)(Zhao et al., 2021).
How are deaths related to non-optimal temperatures projected to change in the future?
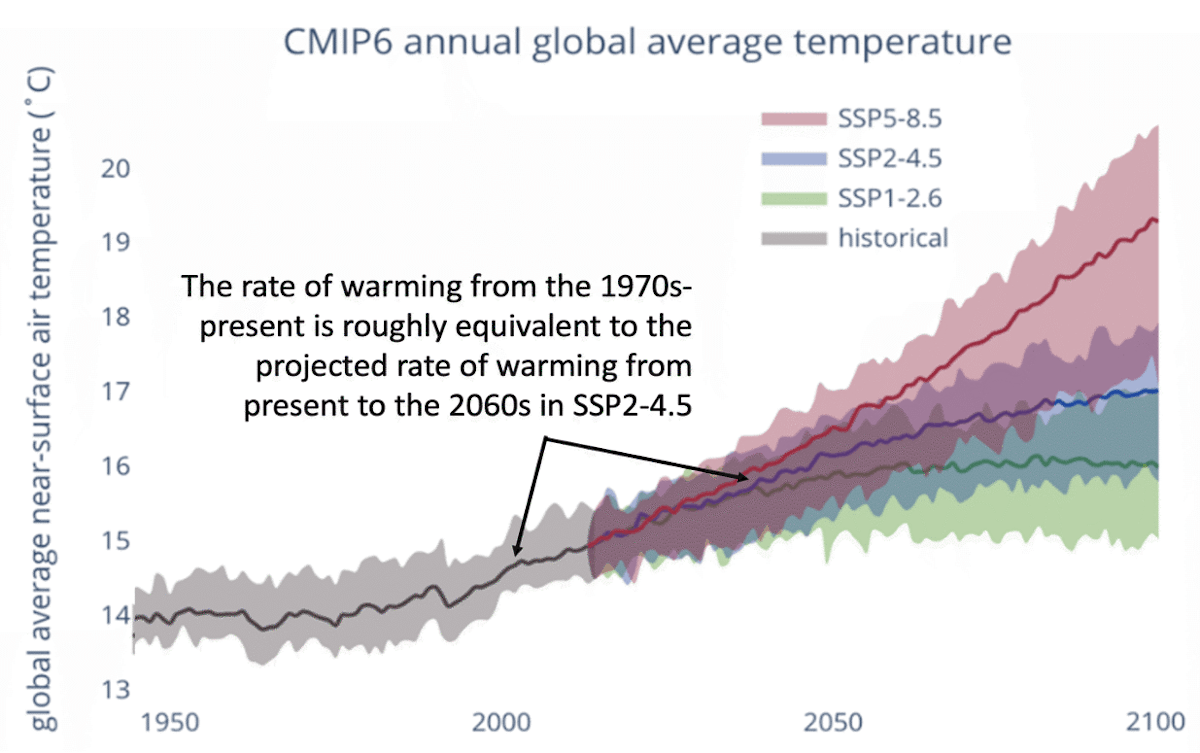
Despite historical trends, most studies that make projections of deaths over the remainder of the century still project increases in deaths, both isolating for heat deaths and even accounting for reductions in cold deaths. This has been projected globally (Bressler et al., 2021; Carleton et al., 2022; Gasparrini et al., 2017) and in the United States (Honda et al., 2014; Hsiang et al., 2017; Shindell et al., 2020) (Executive Summary Fig. 2). Shindell et al., (2020) for example, projects an increase in the heat death rate by 4X current amounts under RCP4.5. This is despite historical decreases in deaths and despite the fact that the rate of warming in RCP4.5 is roughly equivalent to the historical rate of warming (Fig. 20).
The primary cause of the wide range of projections in the future is 1) whether both heat and cold deaths are considered or only heat deaths (Guo et al., 2018) are considered, and 2) how or whether adaptation or changes in resilience are considered. Many studies assume very limited adaptation (e.g., figure 10), meaning that the optimal temperature and the sensitivity about the optimum temperature (e.g., the flatness of the temperature-death risk curves) is not allowed to vary with time.
Given the strength of the observed relationship between the optimum temperature and the most frequently experienced temperature in the current climate as well as the reduction in heat deaths despite warming over time, any projection that does not allow the minimum mortality temperature to adjust with local warming cannot provide credible projections of changes in deaths due to non-optimal temperature. This is acknowledged in the text of several studies that do not attempt to account for adaptation. For example, Gasparrini et al. (2017) stated:
“Our projections of current estimates of temperature–mortality associations under future warming scenarios allow isolation of the effects of the changing climate, but ignore contributions from other factors, including demographic changes and adaptation. The reported figures should therefore be interpreted as potential impacts under well-defined but hypothetical scenarios and not as predictions of future excess mortality.”
In addition to how studies deal with adaptation and changes in resilience, death projections also vary significantly depending on the region, emissions scenario, and timeframe (Carleton et al., 2022; Deschênes and Greenstone, 2011) (Fig. 21 and Fig. 22).
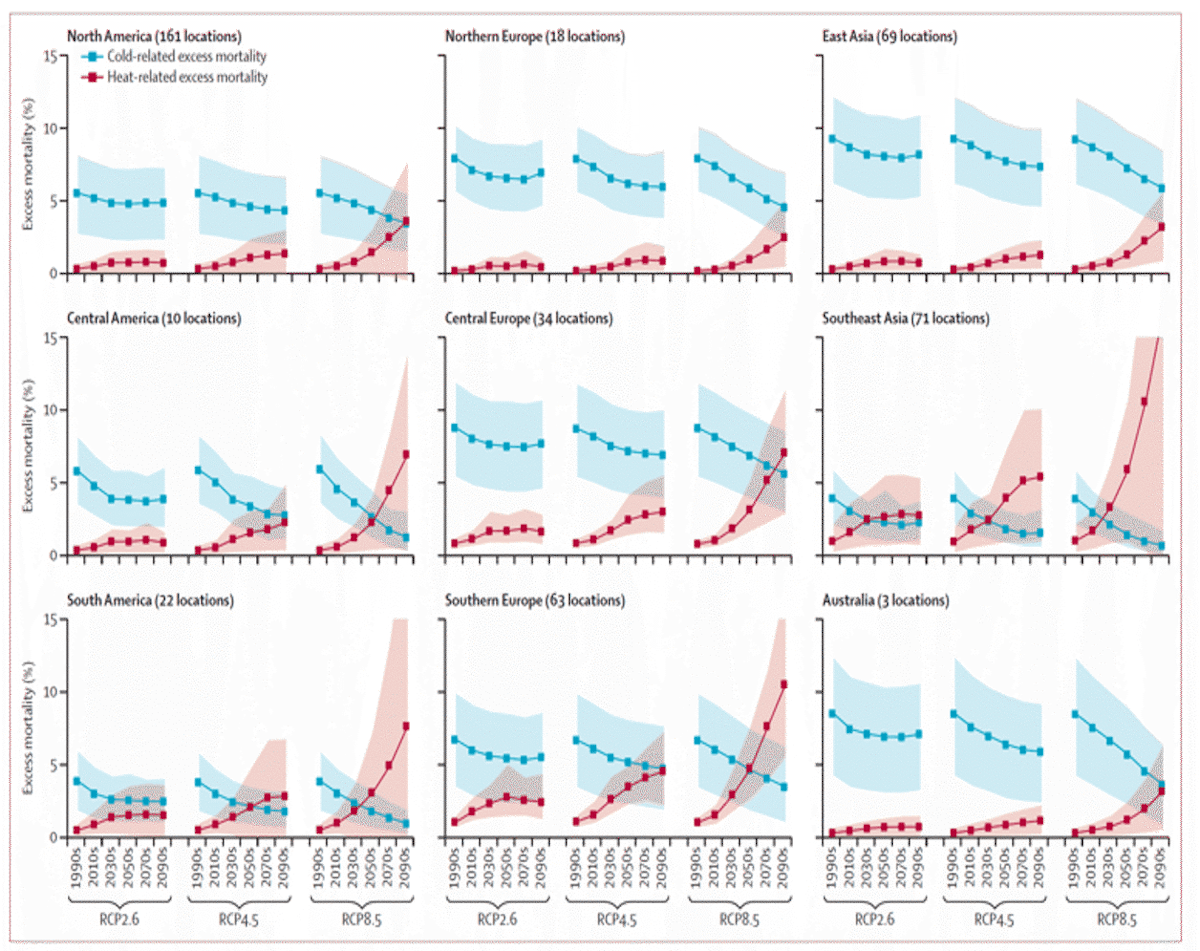
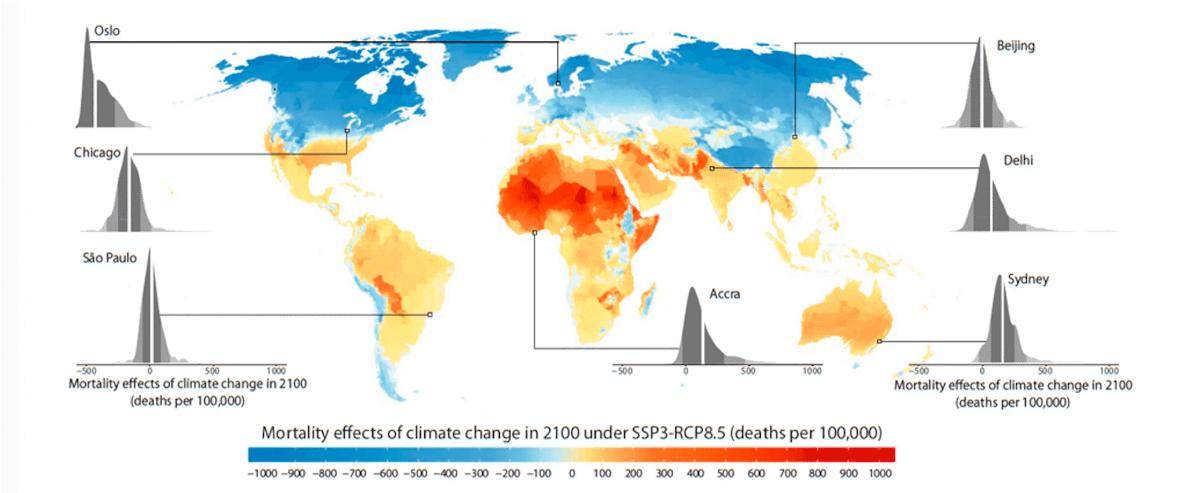
A prominent study that made an explicit effort to account for adaptation and income growth (Carleton et al., 2022) calculated a ~10% increase in total death rates under a future scenario of high emissions (RCP8.5) and low GDP growth (SSP3), but there was great spatial heterogeneity in the projection with net death rates increasing in the tropics, and net death rates decreasing at higher latitudes (Fig. 23). This heterogeneity illustrates the importance of regional population and GDP projections for future death rate projections.
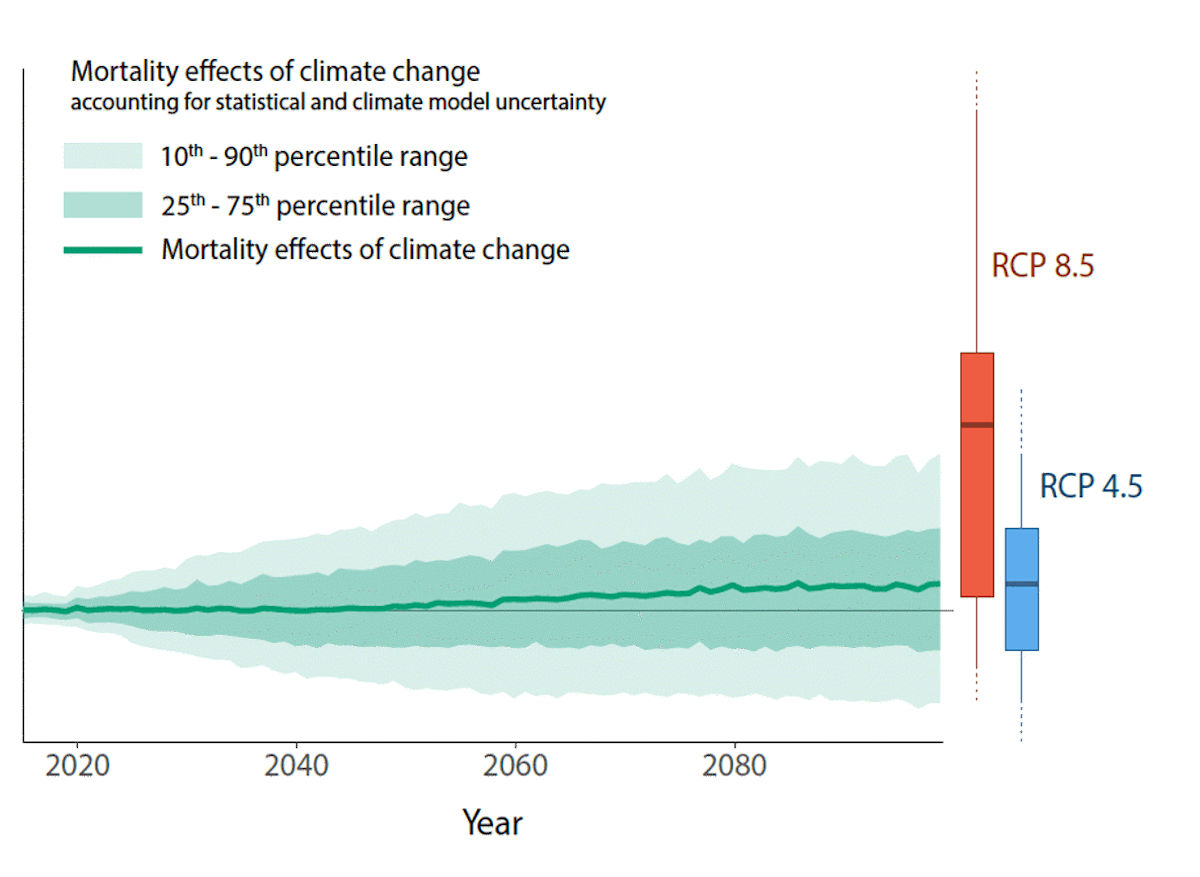
Under a middle emissions scenario (RCP4.5) and low GDP growth (SSP3), Carleton et al., (2022) calculate approximately a 1.4% increase in the total death rate. In this case, the probability distribution indicates a ~60% chance of an increase in death rate by 2100 and a ~40% chance of a decrease (Fig. 24). Under a middle GDP growth (SSP2) and middle emissions scenario (RCP4.5), hot and cold death changes are projected to roughly cancel out, and temperature-related mortality stays constant over the century (Carleton et al., 2022, Appendix Figure F.5).
Overall, there is a very wide range of projections for deaths due to non-optimal temperatures. They depend heavily on whether reductions in cold deaths are considered; the choice of location, emissions scenario, and timeframe; and whether the researchers factor in adaptation and changes in resilience.
The tight relationship between optimal temperature and most frequently observed temperature indicates that a high degree of adaptability is achievable, and declining heat death rates in many countries indicate that changes in resilience are predominating over warming. Thus, the credibility of studies that indicate a large increase in net deaths without an increase in the rate of warming is highly questionable.
Regardless, the primary reasons for the strong acclimation across space in the current climate and increased resilience across time should be paramount research priorities going forward so that public resources can be best allocated towards the causes that most effectively increase adaptation and resiliency as the climate warms.
References:
Arbuthnott, K., et al., 2016. Changes in population susceptibility to heat and cold over time: assessing adaptation to climate change. Environmental Health. 15.
Armstrong, B., et al., 2017. Longer-Term Impact of High and Low Temperature on Mortality: An International Study to Clarify Length of Mortality Displacement. Environmental Health Perspectives. 125, 107009.
Armstrong, B., et al., 2019. The Role of Humidity in Associations of High Temperature with Mortality: A Multicountry, Multicity Study. Environmental Health Perspectives. 127, 097007.
Barreca, A., et al., 2016. Adapting to Climate Change: The Remarkable Decline in the US Temperature-Mortality Relationship over the Twentieth Century. Journal of Political Economy. 124, 105-159.
Bobb, J. F., et al., 2014. Heat-Related Mortality and Adaptation to Heat in the United States. Environ Health Perspect. 122.
Bressler, R. D., et al., 2021. Estimates of country level temperature-related mortality damage functions. Scientific Reports. 11.
Burkart, K. G., et al., 2021. Estimating the cause-specific relative risks of non-optimal temperature on daily mortality: a two-part modelling approach applied to the Global Burden of Disease Study. The Lancet. 398, 685-697.
Carleton, T., et al., 2022. Valuing the Global Mortality Consequences of Climate Change Accounting for Adaptation Costs and Benefits. The Quarterly Journal of Economics.
Carson, C., et al., 2006. Declining Vulnerability to Temperature-related Mortality in London over the 20th Century. American Journal of Epidemiology. 164, 77-84.
Christidis, N., et al., 2010. Causes for the recent changes in cold- and heat-related mortality in England and Wales. Climatic Change. 102, 539-553.
Coates, L., et al., 2014. Exploring 167 years of vulnerability: An examination of extreme heat events in Australia 1844–2010. Environmental Science & Policy. 42, 33-44.
Davis, R. E., et al., 2003. Changing heat-related mortality in the United States. Environmental Health Perspectives. 111, 1712-1718.
Deschênes, O., Greenstone, M., 2011. Climate Change, Mortality, and Adaptation: Evidence from Annual Fluctuations in Weather in the US. American Economic Journal: Applied Economics. 3, 152-185.
Folkerts, M. A., et al., 2020. Long Term Adaptation to Heat Stress: Shifts in the Minimum Mortality Temperature in the Netherlands. Frontiers in physiology. 11, 225-225.
Gasparrini, A., et al., 2015a. Temporal Variation in Heat–Mortality Associations: A Multicountry Study. Huan jing yu jian kang zhan wang = Environmental health perspectives, Chinese edition. 123, 1200-1207.
Gasparrini, A., et al., 2015b. Mortality risk attributable to high and low ambient temperature: a multicountry observational study. The Lancet. 386, 369-375.
Gasparrini, A., et al., 2017. Projections of temperature-related excess mortality under climate change scenarios. The Lancet Planetary Health. 1, e360-e367.
Guo, Y., et al., 2014. Global Variation in the Effects of Ambient Temperature on Mortality. Epidemiology. 25, 781-789.
Guo, Y., et al., 2018. Quantifying excess deaths related to heatwaves under climate change scenarios: A multicountry time series modelling study. PLOS Medicine. 15, e1002629.
Heo, S., et al., 2016. Long-term changes in the heat–mortality relationship according to heterogeneous regional climate: a time-series study in South Korea. BMJ Open. 6, e011786.
Honda, Y., et al., 2014. Heat-related mortality risk model for climate change impact projection. Environmental Health and Preventive Medicine. 19, 56-63.
Hsiang, S., et al., 2017. Estimating economic damage from climate change in the United States. Science. 356, 1362-1369.
Huang, C., et al., 2011. Projecting Future Heat-Related Mortality under Climate Change Scenarios: A Systematic Review. Environmental Health Perspectives. 119, 1681-1690.
Kinney, P., 2018. Temporal Trends in Heat-Related Mortality: Implications for Future Projections. Atmosphere. 9, 409.
Kyselý, J., Plavcová, E., 2012. Declining impacts of hot spells on mortality in the Czech Republic, 1986–2009: adaptation to climate change? Climatic Change. 113, 437-453.
Leone, M., et al., 2013. A time series study on the effects of heat on mortality and evaluation of heterogeneity into European and Eastern-Southern Mediterranean cities: results of EU CIRCE project. Environmental Health. 12, 55.
Madaniyazi, L., et al., 2022. Seasonal variation in mortality and the role of temperature: a multi-country multi-city study. International Journal of Epidemiology. 51, 122-133.
Martínez-Solanas, È., Basagaña, X., 2019. Temporal changes in temperature-related mortality in Spain and effect of the implementation of a Heat Health Prevention Plan. Environmental research. 169, 102-113.
Martínez-Solanas, È., et al., 2021. Projections of temperature-attributable mortality in Europe: a time series analysis of 147 contiguous regions in 16 countries. The Lancet Planetary Health. 5, e446-e454.
Matzarakis, A., et al., 2011. Human biometeorological evaluation of heat-related mortality in Vienna. Theoretical and Applied Climatology. 105, 1-10.
Murray, C. J. L., et al., 2020. Global burden of 87 risk factors in 204 countries and territories, 1990–2019: a systematic analysis for the Global Burden of Disease Study 2019. The Lancet. 396, 1223-1249.
Ng, C. F. S., et al., 2016. Heat-related mortality: Effect modification and adaptation in Japan from 1972 to 2010. Global Environmental Change. 39, 234-243.
Nordio, F., et al., 2015. Changing patterns of the temperature–mortality association by time and location in the US, and implications for climate change. Environment International. 81, 80-86.
Pavanello, F., et al., 2021. Air-conditioning and the adaptation cooling deficit in emerging economies. Nature Communications. 12.
Petkova, E. P., et al., 2014. Heat and Mortality in New York City Since the Beginning of the 20th Century. Epidemiology. 25, 554-560.
Rennert, K., et al., 2022. Comprehensive Evidence Implies a Higher Social Cost of CO2. Nature.
Rizwan, A. M.; Dennis, L. Y. C.; Liu, C. 2008. A review on the generation, determination, and mitigation of Urban Heat Island. J.Environ. Sci. 20(1), 120−128
Schwartz, J. D., et al., 2015. Projections of temperature-attributable premature deaths in 209 U.S. cities using a cluster-based Poisson approach. Environmental Health. 14.
Sera, F., et al., 2019. How urban characteristics affect vulnerability to heat and cold: a multi-country analysis. International Journal of Epidemiology. 48, 1101-1112.
Sera, F., Gasparrini, A., 2022. Extended two-stage designs for environmental research. Environmental Health. 21.
Sera, F., et al., 2020. Air Conditioning and Heat-related Mortality. Epidemiology. 31, 779-787.
Sheridan, S. C., Allen, M. J., 2018. Temporal trends in human vulnerability to excessive heat. Environmental Research Letters. 13, 043001.
Sheridan, S. C., et al., 2009. Trends in heat-related mortality in the United States, 1975–2004. Natural Hazards. 50, 145-160.
Shindell, D., et al., 2020. The Effects of Heat Exposure on Human Mortality Throughout the United States. GeoHealth. 4, e2019GH000234.
Tobías, A., et al., 2021. Geographical Variations of the Minimum Mortality Temperature at a Global Scale. Environmental Epidemiology. 5, e169.
Vicedo-Cabrera, A. M., et al., 2019. Hands-on Tutorial on a Modeling Framework for Projections of Climate Change Impacts on Health. Epidemiology. 30, 321.
Vicedo-Cabrera, A. M., et al., 2018. A multi-country analysis on potential adaptive mechanisms to cold and heat in a changing climate. Environment International. 111, 239-246.
Watts, N., et al., 2015. Health and climate change: policy responses to protect public health. The Lancet. 386, 1861-1914.
Yang, J., et al., 2015. Cardiovascular mortality risk attributable to ambient temperature in China. Heart. 101, 1966-1972.
Yin, Q., et al., 2019. Mapping the increased minimum mortality temperatures in the context of global climate change. Nature Communications. 10.
Zhao, Q., et al., 2021. Global, regional, and national burden of mortality associated with non-optimal ambient temperatures from 2000 to 2019: a three-stage modelling study. The Lancet Planetary Health. 5, e415-e425.
Åström, D. O., et al., 2013. Acute Fatal Effects of Short-Lasting Extreme Temperatures in Stockholm, Sweden. Epidemiology. 24, 820-829.

